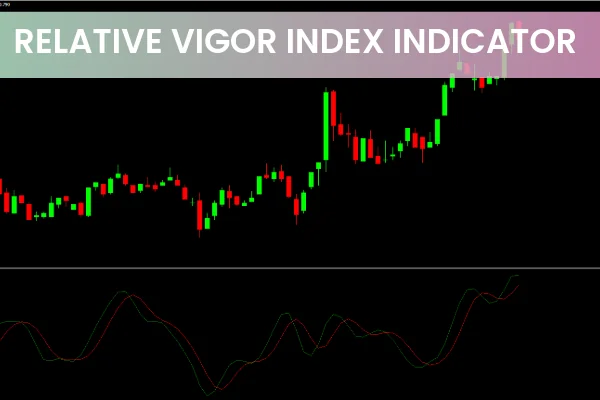
The Relative Vigor Index (RVI) is a powerful technical indicator used to measure the strength of a trend in the market. Based on the principle that trends are harder to reverse the longer they last, the RVI helps traders identify potential turning points and market momentum.
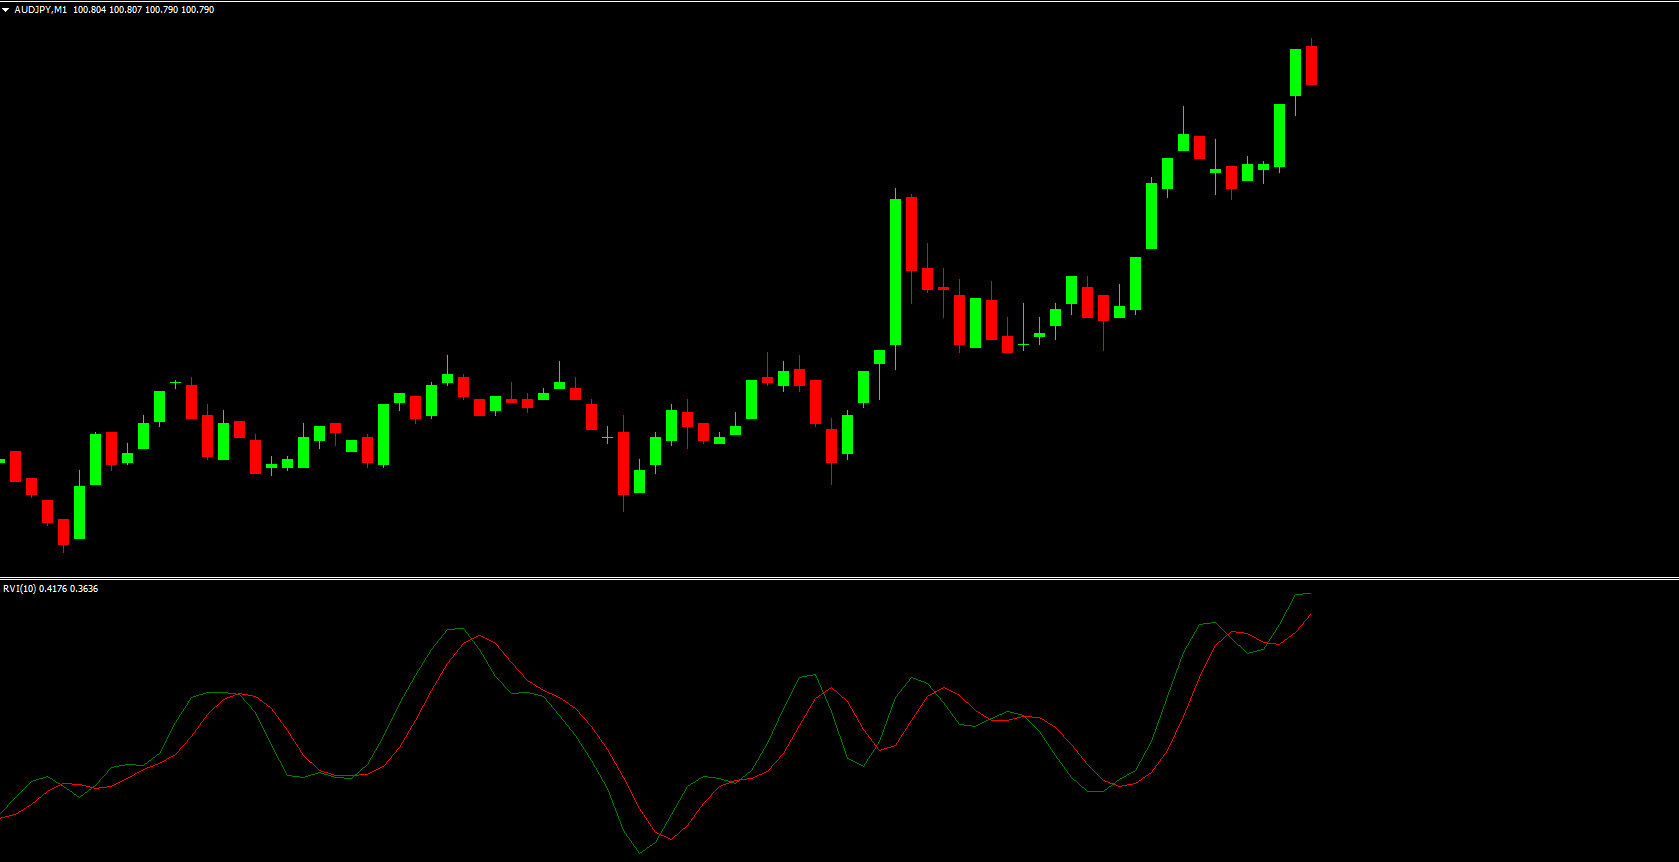
The indicator consists of two lines: the main line and the signal line. The main line is derived from the difference between the closing price and a moving average of the closing price, while the signal line is a moving average of the main line. This setup allows traders to spot bullish and bearish trends effectively.
How the Relative Vigor Index Works
Bullish Signal: When the main line is above the signal line, it indicates upward momentum.
Bearish Signal: When the main line is below the signal line, it indicates downward momentum.
Neutral Market: A reading around 50 suggests no clear trend.
Traders often use the RVI in combination with other technical indicators or Price Action patterns to confirm trading signals and enhance accuracy.
RVI Buy and Sell Signals
There are three main types of trading signals provided by the RVI:
Buy Signal: Occurs when the RVI crosses above 20 from below, signaling bullish momentum.
Sell Signal: Occurs when the RVI crosses below 80 from above, signaling bearish momentum.
Exit/Take Profit Signal: Occurs when the RVI crosses back above 20 after being below 80, confirming a potential trend change.
The RVI works on the idea that prices tend to close near the highs during an uptrend and near the lows during a downtrend. This relationship between closing prices is used to calculate the RVI and generate signals.
How to Interpret the RVI Indicator
The RVI is particularly useful for determining overbought and oversold conditions in the market. Key points to watch include:
RVI Above Signal Line: Green line above red line indicates a potential bullish trend.
RVI Below Signal Line: Red line above green line signals a potential bearish trend.
By observing these signals alongside other indicators or price action, traders can improve the timing of their entries and exits in forex trading.
Benefits of Using the RVI Indicator
Identifies Trend Strength and potential reversals.
Highlights overbought and oversold conditions.
Suitable for standalone use or combined with other indicators.
Works across multiple timeframes, ideal for Scalping, intraday, and swing trading.
Helps improve trading decisions by measuring market “vigor” and weakness.
Conclusion
The Relative Vigor Index (RVI) is an essential tool for forex traders seeking to measure trend strength and momentum. By signaling bullish and bearish trends and helping detect overbought or oversold conditions, it can improve the accuracy of trading strategies. Download the RVI Indicator for MT4 from IndicatorForest.com and enhance your trading analysis today.
FAQ
2 Downloads
Published:
Nov 11, 2025 23:52 PM
Category: