Decoding Institutional Momentum with the Ssm Velocity Floating Levels Indicator
In the highly competitive landscape of Forex trading, chasing lagging signals is one of the fastest ways to deplete a trading account. Many standard oscillators like the Relative Strength Index (RSI) or classic Stochastics use fixed overbought and oversold thresholds (such as 70/30 or 80/20). While these rigid markers work well in range-bound markets, they break down entirely during powerful structural expansions, trapping traders into selling early in powerful uptrends or buying too soon during aggressive market markdowns.
The Ssm Velocity Floating Levels Indicator solves this systemic issue. By implementing dynamic, adaptive bands that expand and contract alongside live market volatility, this advanced technical tool provides an accurate, real-time map of underlying asset velocity.
The Power of Adaptive Volatility Bands
Unlike static technical tools, the architectural framework of the Ssm Velocity Floating Levels system adapts directly to market conditions. The core algorithm tracks structural momentum velocity (with adjustable settings such as a 50-period smoothing filter) and plots it against custom, self-adjusting dynamic envelopes—often referred to as floating levels.
Instead of a basic monochrome line, the signal wave changes color in real time to provide immediate, mechanical feedback regarding trend changes:
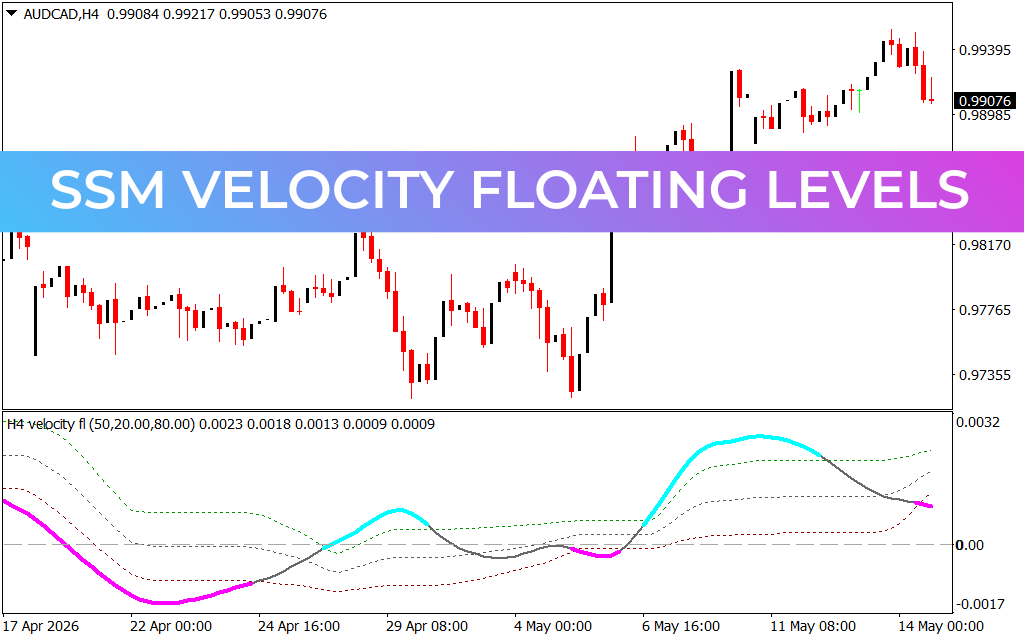
- Cyan Signal Line: Represents high-velocity bullish momentum. When the wave turns cyan and climbs toward the upper dotted green floating level, it confirms that institutional buyers have control, validating long entries and Trend Continuation setups.
- Magenta Signal Line: Signals strong bearish velocity. When the wave changes to magenta and drops toward the lower dotted red floating baseline, it warns that heavy institutional selling is underway, prioritizing short positions.
- Grey Signal Line: Indicates a transitional or neutral momentum phase. When the wave turns grey, momentum is slowing down, meaning the market is consolidating or preparing for a potential structural reversal.
Implementing Ssm Velocity into Your Trade Routine
Integrating the Ssm Velocity Floating Levels indicator into your execution checklist helps remove psychological guesswork and establishes objective trading rules:
- Precision Breakout Trading: When the momentum line transitions from grey to cyan and pierces above the upper floating level, it confirms a high-probability bullish breakout. Conversely, a cross below the lower floating level accompanied by a magenta shift confirms a valid breakdown.
- Dynamic Reversal Zones: Because the overbought and oversold thresholds are "floating" rather than fixed, they accurately represent true statistical extremes based on recent volatility. When a cyan wave peaks well outside the upper band and shifts to grey, it flags a low-risk window to secure profits.
- Trend Filtering: Traders can use the center zeroaxis line as a definitive trend filter, staying strictly long when the wave operates above zero and short when it sustains below it.
Macro Precision on the 4-Hour (H4) Chart
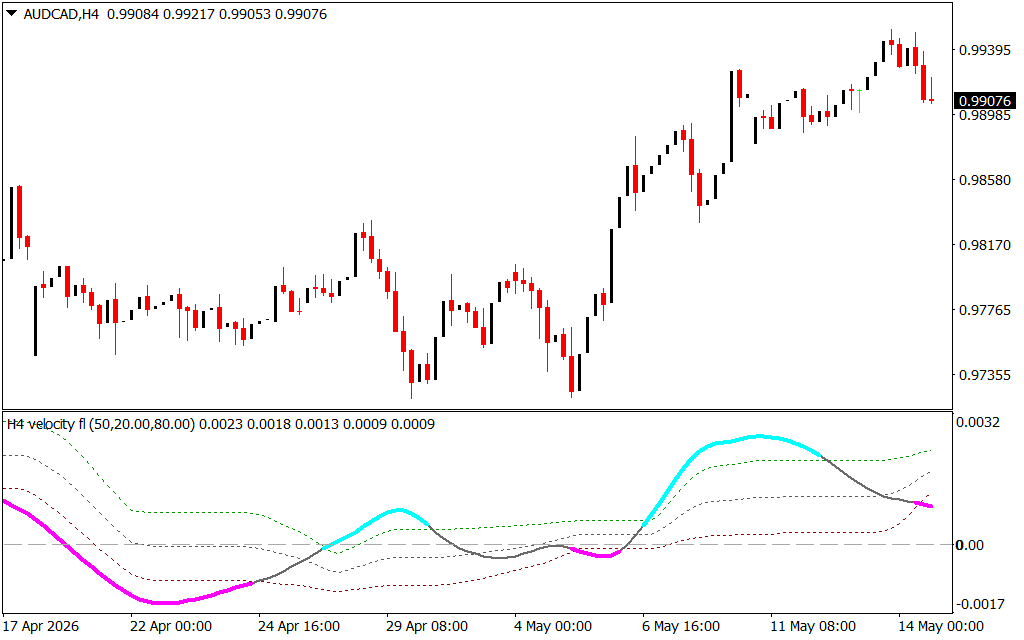
While scalable to shorter intraday timeframes, this indicator offers exceptional structural clarity on macro frames like the 4-hour (H4) chart. As displayed on the AUD/CAD H4 layout, the tool smooths out daily market noise to map clean cyclical waves over weeks of trading history. By aligning your intraday trade execution with these macro floating targets, you ensure that you are always trading in harmony with institutional order flow.
1 Download
Last Update:
May 14, 2026 21:15 PM
Published:
Jan 22, 2026 01:08 AM
Category: