The CCI Histogram Indicator is a powerful Metatrader tool based on the renowned Woodies Commodity Channel Index (Woodies CCI). Designed for MT4, this non-repaint indicator effectively highlights three key market conditions: BULLISH, BEARISH, and FLAT. Forex traders can use the histogram’s color changes to generate reliable buy and sell signals, making it a versatile tool for any trend trading strategy.
The indicator is suitable for all timeframes and can be applied to both intraday and long-term trading strategies. Its simplicity makes it accessible to beginners, while advanced traders can incorporate it seamlessly into more complex technical strategies.
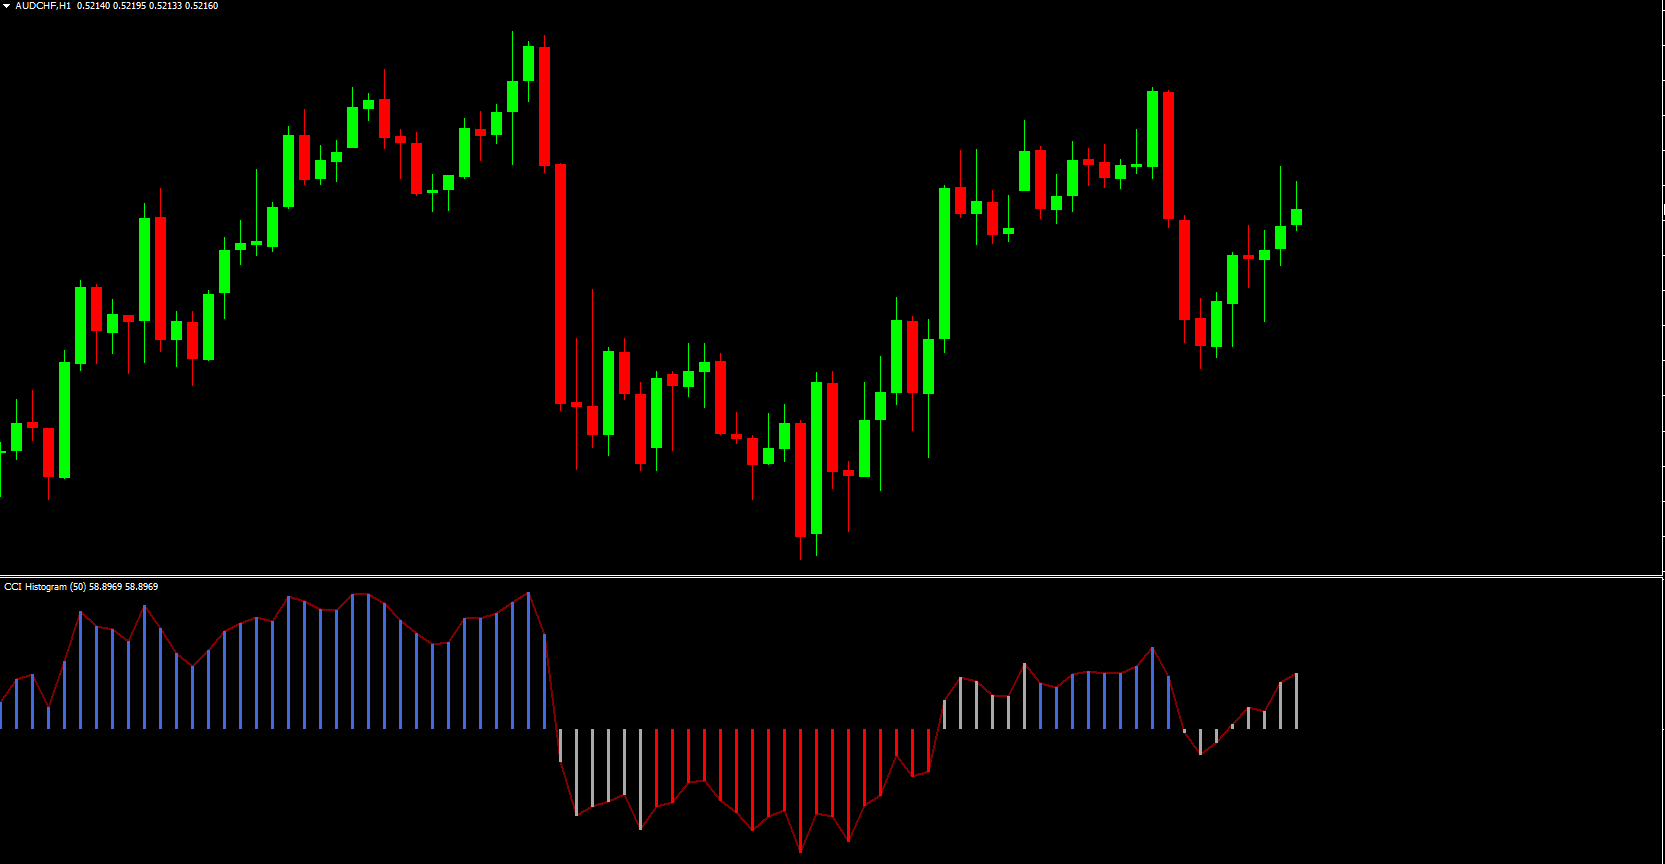
How the CCI Histogram Indicator Works
The CCI Histogram Indicator for MT4 displays market trends using distinct colors:
BULLISH trend: Blue
BEARISH trend: Red
FLAT trend: Dark Gray
Traders can easily interpret these visual signals to enter or exit trades efficiently.
CCI Histogram Indicator Trading Signals
Buy Signals:
Enter a BUY position when the histogram turns BLUE, signaling the start of a bullish trend.
Place a stop-loss below the previous swing low.
Optionally, exit the trade when the histogram shifts to DARK GRAY, indicating a flat or weakening trend.
Sell Signals:
Enter a SELL position when the histogram turns RED, signaling the start of a bearish trend.
Place a stop-loss above the previous swing high.
Traders can exit when the histogram turns DARK GRAY, showing a FLAT trend.
Aggressive Strategy:
Traders can ignore the flat trend signal and trade directly on the color change from BLUE to RED and vice versa.
For optimal results, place trades near support and resistance levels, which often indicate potential reversals.
Since the CCI Histogram Indicator is non-repainting, traders can rely on its signals for automated trading or combine it with other tools like trendlines, channels, and breakout strategies to enhance trading accuracy.
Advantages of the CCI Histogram Indicator
Trend Identification: Clearly shows bullish, bearish, and flat market conditions.
Non-Repaint: Provides reliable signals without altering previous data.
Versatile: Works on all timeframes and suits intraday and long-term strategies.
Beginner-Friendly: Easy to read and understand for new traders.
Free to Download: Accessible for any MT4 user.
Conclusion
The CCI Histogram Indicator for MT4 is an essential tool for forex trend traders. Its ability to clearly display BULLISH, BEARISH, and FLAT trends improves trade efficiency and decision-making. Traders can visually identify buy, sell, and exit points while incorporating the indicator into any technical trend trading strategy. Best of all, it is free to download and easy to install, making it a must-have for both novice and advanced traders.
For more effective trading tools and strategies, visit IndicatorForest.com.
FAQ
Published:
Nov 24, 2025 11:36 AM
Category: