The Forex Atron Indicator for MT4 is a volatility-based trading tool designed to help traders identify potential trend reversals and market turning points. By analyzing market deviation and price behavior, the Forex Atron Indicator provides a clear visual representation of volatility zones, which can support more accurate trade entries and exits. Traders on IndicatorForest.com frequently use this tool due to its simplicity, reliability, and compatibility with all major currency pairs.
Understanding the Forex Atron Indicator Structure
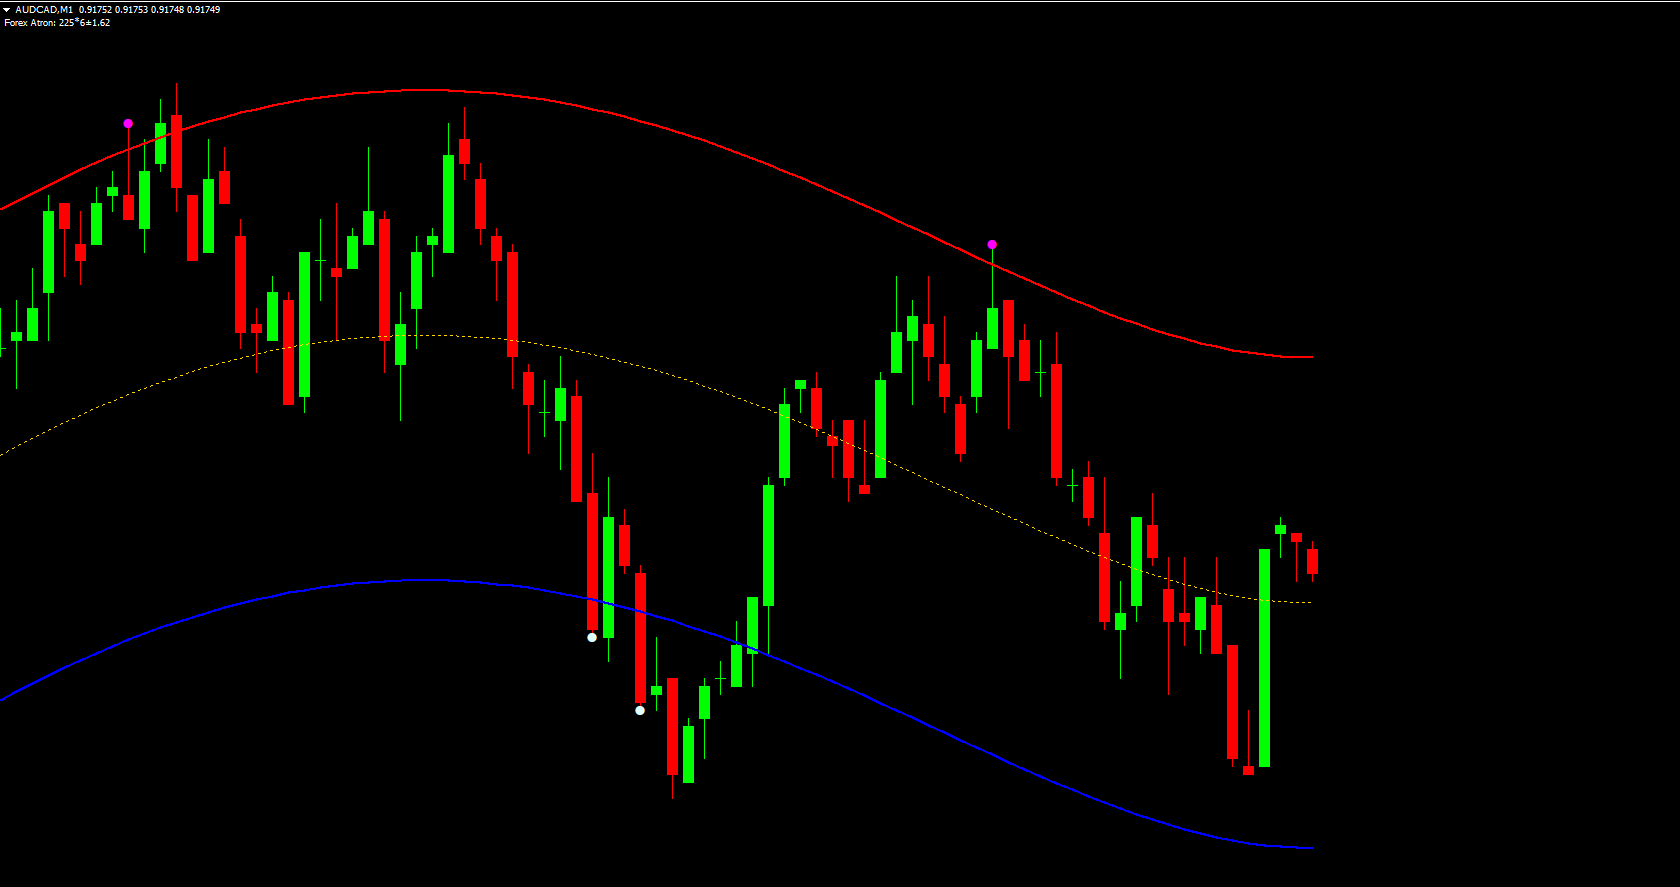
The Forex Atron Indicator highlights price volatility and potential trend reversals by creating three distinct bands on the chart. It uses standard deviation calculations to generate these price zones and visually represent how far current prices stray from the average.
Upper Band (Red Line)
The upper band indicates higher price volatility. When the market begins to push into or above this zone, it often signals an overextended move and possible exhaustion. This area can be useful for spotting bearish reversal opportunities.
Middle Band (Yellow Dotted Line)
The middle line acts as the mean or average price for the chosen period. It helps traders understand the market’s equilibrium level. Price interactions with the middle band often signal trend confirmations or potential period consolidations.
Lower Band (Blue Line)
The lower band shows reduced price volatility. When price reaches or dips near this zone, it may indicate oversold conditions or a potential bullish reversal.
How to Use the Forex Atron Indicator for MT4
When applied to a chart, the Forex Atron Indicator reveals potential BUY and SELL zones derived from volatility deviations. In the example of the GBP/JPY H4 chart, the indicator provides clear, visually intuitive signals:
Buy Strategy Using Atron Bands
A bullish signal may occur when price approaches or touches the lower blue band. This area represents decreased volatility, often leading to a rebound. Traders may consider long positions when candlestick confirmation aligns with the lower band approach.
Sell Strategy Using Atron Bands
A bearish signal may arise when price approaches or touches the upper red band. This can indicate heightened volatility and potential market correction. When combined with Price Action patterns, this zone can be used to anticipate downward movement.
Combining Atron with Other Tools
While the Forex Atron Indicator is robust, it shouldn’t be used alone. Due to the fast-moving nature of forex markets, combining the indicator with additional forms of technical analysis improves accuracy. Recommended pairings include:
Trendlines and channel analysis
RSI or Stochastic oscillator confirmations
Support And Resistance mapping
Multi-timeframe confirmation for stronger signal reliability
These complementary tools help validate Atron’s volatility-based signals, making your overall trading strategy more robust.
Advantages of the Forex Atron Indicator
The Forex Atron Indicator offers several benefits to MT4 traders:
Straightforward interpretation, ideal for beginners
Visual clarity for spotting trend reversals
Adaptable to various timeframes
Works well with manual trading strategies
Enhances risk management by highlighting volatility extremes
Its versatility makes it a valuable addition for intraday, swing, and long-term traders alike.
Conclusion
The Forex Atron Indicator for MT4, with its three volatility-based bands, provides traders with a clear visual representation of market conditions. By observing how price behaves near the upper and lower bands, traders can identify high-probability reversal points and improve entry timing. To enhance accuracy, always combine this indicator with additional technical tools. Explore more powerful forex indicators and trading tools at IndicatorForest.com.
FAQ
3 Downloads
Published:
Nov 13, 2025 22:51 PM
Category: