Decode Market Imbalances: The Ultimate Difference Between OOP Indicator
In technical analysis, tracking institutional volume and finding market imbalances is where institutional traders gain their real edge. Standard oscillators tell you if a market is overbought, but they fail to reveal the absolute variance between aggressive buyers and sellers. The Difference Between OOP Indicator bridges this data gap by calculating and displaying underlying market imbalances directly in a responsive histogram panel beneath your Price Action charts.
What is the Difference Between OOP Indicator?
The Difference Between OOP indicator is a specialized volume and momentum tool designed to measure institutional transaction variances. Rather than looking purely at price candle closing metrics, it isolates specific open-interest or order-flow calculations (OOP data parameters) to track structural market divergence.
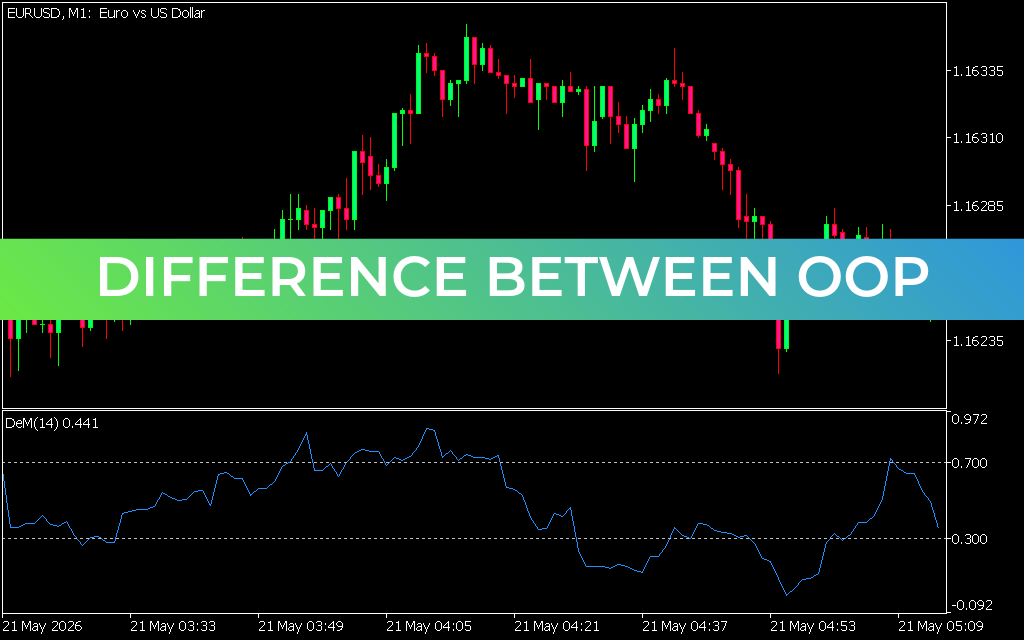
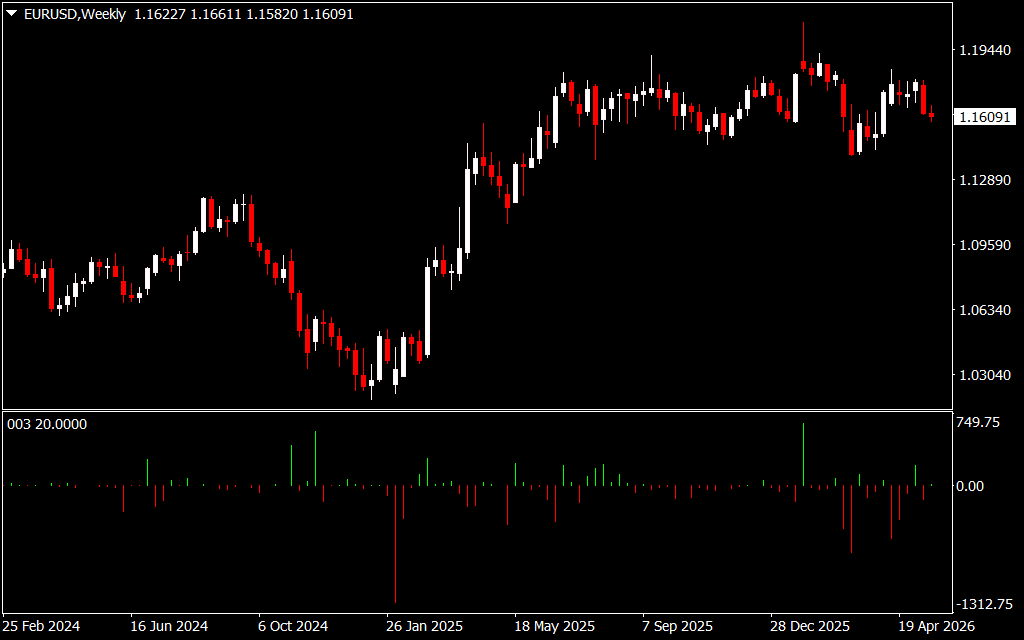
As displayed on the EURUSD weekly chart, the indicator plots clean histogram spikes above and below a central zero-line equilibrium:
- Green Histogram Spikes (Above 0.00): These signals demonstrate a dominant surge in positive institutional imbalance, confirming that aggressive buying pressure is driving market momentum.
- Red Histogram Spikes (Below 0.00): These sharp downward bars signal heavy sell-side imbalance, revealing strong distributions or heavy liquidation phases by market makers.
Strategic Benefits for Long-Term and Swing Traders
- Spots Hidden Institutional Footprints: Price candles can sometimes show fake breakouts, but the underlying volume metrics plotted by the Difference Between OOP tool reveal if actual capital is backing up the move.
- Early Reversal Alerts: Massive spike extensions—such as the major red downward histogram bar shown in late 2024—frequently flag absolute seller exhaustion, letting traders front-run high-probability structural turnarounds.
- Clear Momentum Confirmation: When the histogram bars remain steadily above or below the zero-line, it acts as a green light for trend followers to confidently hold onto their open positions.
- Perfect for Higher Timeframes: While highly versatile, this tool excels on macro charts like the Weekly layout, allowing position traders to ignore intraday market noise and align with major capital flows.
How to Trade with the Difference Between OOP Tool
Integrating the Difference Between OOP tool into your trading routine is straightforward. Look for points where the price actions and histogram bars form a clear divergence. If a currency pair is pushing toward a lower structural support floor while the red histogram bars begin shrinking back toward the zero-line, it proves selling momentum is drying up fast.
Once the histogram crosses back over the zero line and puts in a green bar, it triggers an optimized, low-risk buying entry. For institutional-level confirmation, use this indicator alongside major horizontal Supply And Demand zones to enter trades with ultimate precision.
2 Downloads
Last Update:
May 21, 2026 16:17 PM
Published:
Jan 17, 2026 20:34 PM
Category: