Smooth Trend Tracking with the Digital Fast TMA Line Indicator
Trading volatile financial markets requires a clear understanding of market direction and structural value. Many retail traders struggle with traditional moving averages because they are forced into a difficult compromise: choose a short period that responds quickly but suffers from constant false signals (whipsaws), or choose a long period that filters noise but lags behind major turning points. To overcome this limitation, advanced algorithmic traders use centered or triangular calculations. The Digital Fast TMA Line Indicator represents a highly refined solution designed for MetaTrader platforms.
By leveraging a smoothed Triangular Moving Average (TMA) calculation alongside dynamic volatility envelopes, this technical tool provides day traders, scalpers, and swing traders with an incredibly stable baseline for parsing intraday Price Action.
What is the Digital Fast TMA Line?
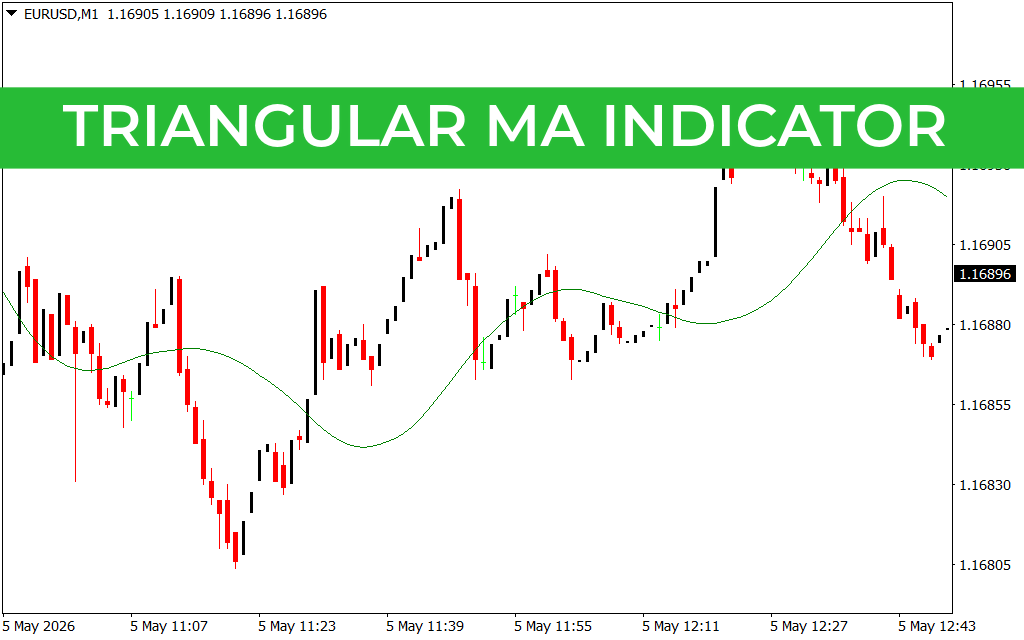
The Triangular Moving Average is essentially a moving average of a moving average. This double-smoothing process gives the TMA line its characteristic wave-like smoothness, eliminating minor price spikes and consolidation noise far more effectively than a standard Exponential Moving Average (EMA).
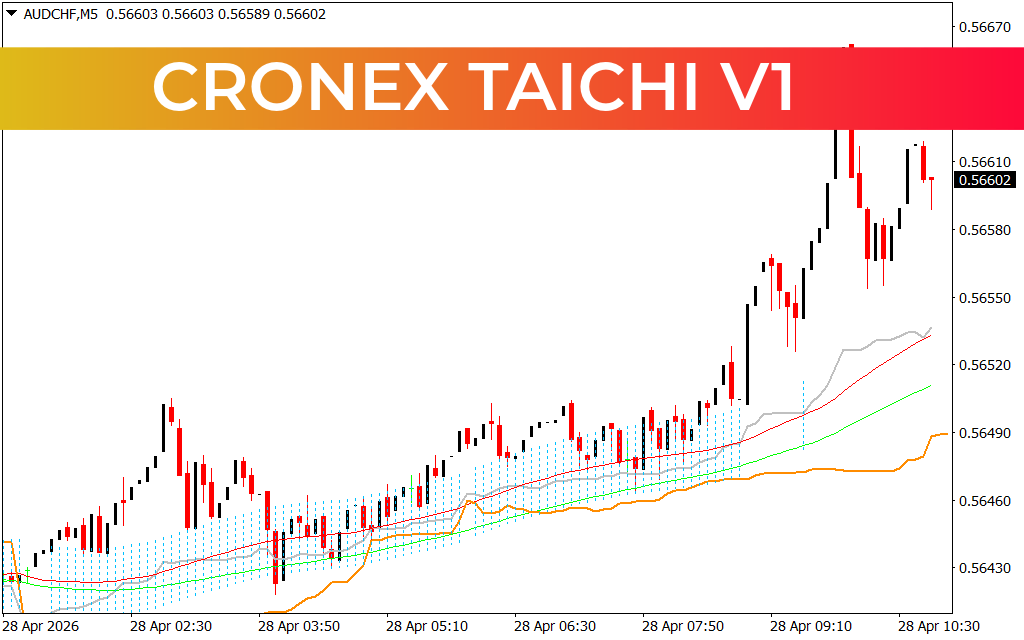
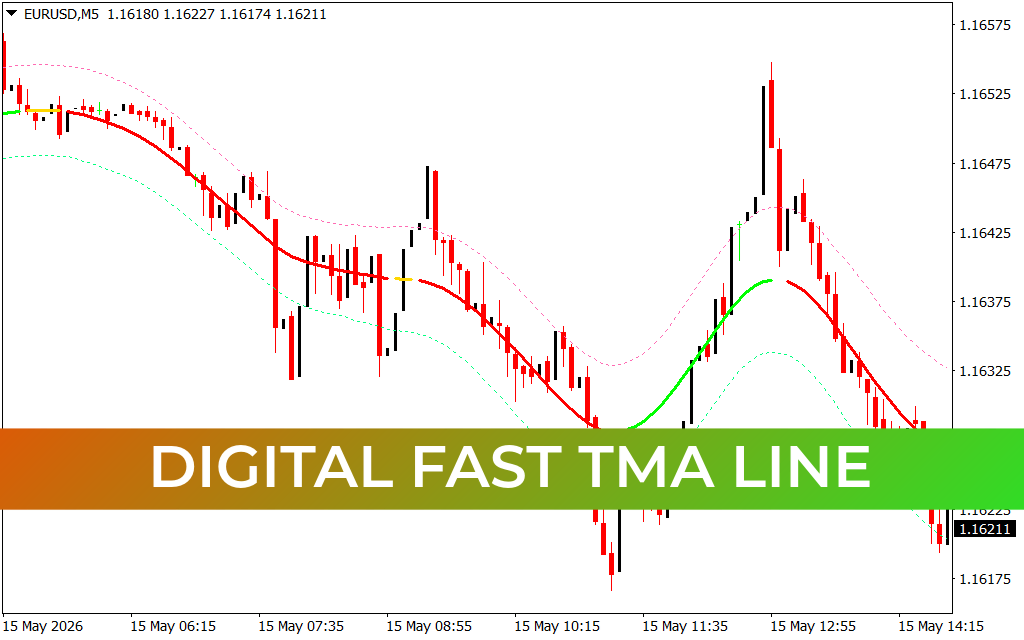
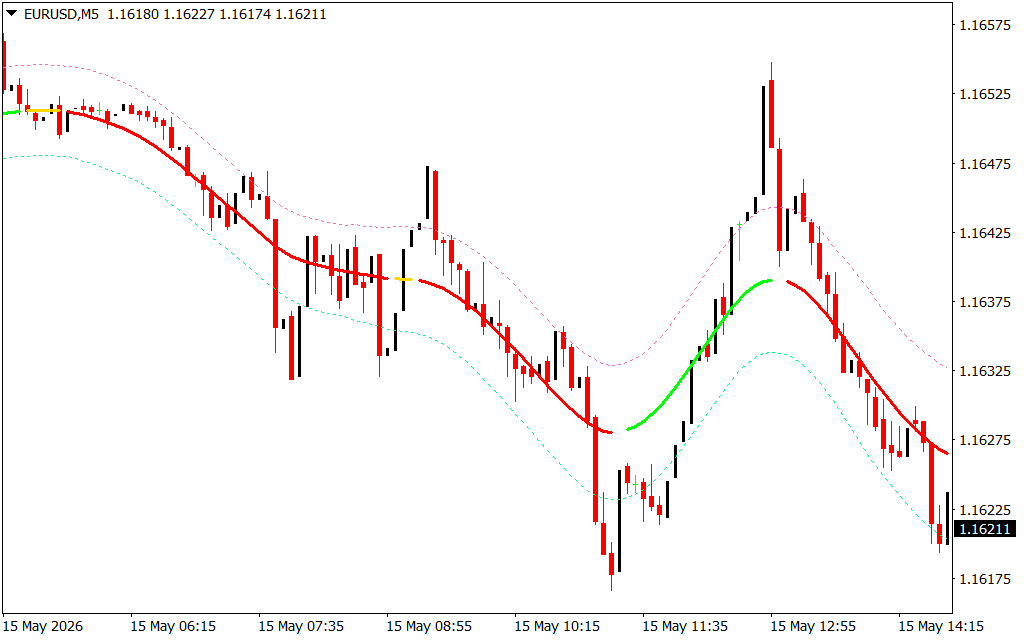
As shown on short-term timeframes like the 5-minute (M5) chart, the Digital Fast TMA Line indicator enhances this formula visually and structurally by introducing a three-line channel band:
- The Core TMA Line (Central Band): Changes color dynamically based on slope direction—turning green during bullish transitions and red during bearish markdowns.
- The Outer Dotted Envelopes: Symmetrically bracket the central line based on Average True Range (ATR) parameters, mapping out short-term overbought and oversold thresholds.
High-Probability Trading Strategies
Integrating the Digital Fast TMA Line into an execution framework provides a highly rule-based approach to navigating volatile pairs like the EUR/USD.
1. Color-Coded Slope Transitions
The simplest way to utilize the indicator is by following its directional slope. When the center line levels out and shifts from red to green, it indicates that near-term momentum has rotated upward, offering a clear signal to look for long setups. When the line bends downward and turns red, a selling bias is established.
2. Channel Rejection and Scalping
Because the outer dotted bands represent volatility extremes, they serve as excellent dynamic Support And Resistance boundaries. In a ranging or mildly trending environment, scalpers can look for price to pierce the upper outer band and reject it, anticipating a quick reversal back toward the central green or red TMA baseline.
3. Filtering False Breakouts
During explosive market movements, price action can temporarily detach from its mathematical averages. To optimize your win rate, the fast-moving TMA channel is best utilized alongside a macro trend filter. By aligning short-term M5 TMA color transitions with a higher-timeframe trend direction (such as the 1-hour chart), traders can seamlessly filter out low-probability counter-trend traps.
Elevate Your Charting Template
The Digital Fast TMA Line Indicator is an essential asset for any level-based technical analyst who wants to eliminate market noise and trade with objective precision. By delivering a beautifully smoothed, color-coded view of momentum alongside clear volatility boundaries, it helps traders execute with confidence and structure in any market environment.
4 Downloads
Last Update:
May 19, 2026 16:01 PM
Published:
Jan 19, 2026 19:52 PM
Category: