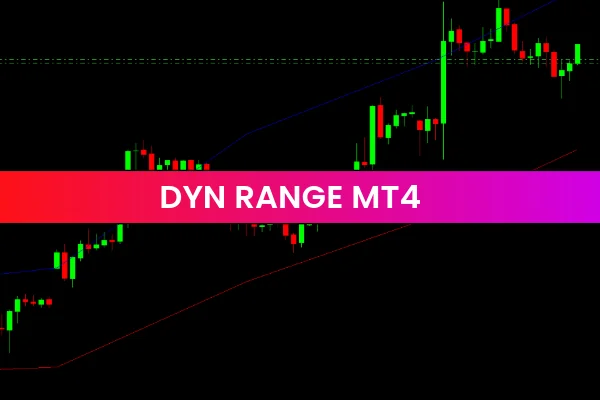
The Dyn Range Indicator for MT4 is a powerful technical tool designed to identify dynamic Support And Resistance levels across various market sessions. Traders use this indicator to analyze price behavior, determine potential entry and exit points, and improve overall market timing. On IndicatorForest.com, the Dyn Range Indicator is a favorite among forex and stock traders seeking accurate trend confirmation and reversal insights.
By automatically detecting dynamic levels that adjust with changing market conditions, the Dyn Range Indicator helps you capture key market turning points. This guide will walk you through how it works, how to trade with it effectively, and why it’s essential for technical analysis in MetaTrader 4.
How the Dyn Range Indicator MT4 Works
The Dyn Range Indicator uses an adaptive algorithm to track price volatility and automatically updates support and resistance levels based on real-time data. Unlike static lines, these dynamic levels shift with Price Action, reflecting true market momentum.
Key Features
Dynamic Adaptation: Updates levels based on price fluctuations.
Session Detection: Works across all trading sessions (Asian, London, New York).
Trend Clarity: Indicates bullish or bearish bias visually.
User-Friendly Interface: Simple integration with MetaTrader 4.
This real-time adjustment allows traders to spot trend reversals, breakouts, and price rejections much faster than with standard indicators.
How to Trade Using the Dyn Range Indicator MT4
Wait for Price to Reach Key Levels
To use the Dyn Range Indicator, monitor when the price touches the dynamic support or resistance lines. These are the zones where market reactions typically occur.
Buy Signal: When the price tests and rejects the lower Dyn Range (support), it suggests bullish momentum.
Sell Signal: When the price fails to break above the upper Dyn Range (resistance), it indicates bearish momentum.
Confirm with Price Action
Combine the Dyn Range signals with candlestick patterns for confirmation. For example, a bullish pin bar forming near the lower Dyn Range confirms a buy setup, while a bearish pin bar near the upper range confirms a sell setup.
Use Trend Direction as Filter
The overall slope of the Dyn Range channel shows the trend direction:
Upward Channel = Bullish Market
Downward Channel = Bearish Market
Trading in the direction of the channel improves accuracy and reduces false signals.
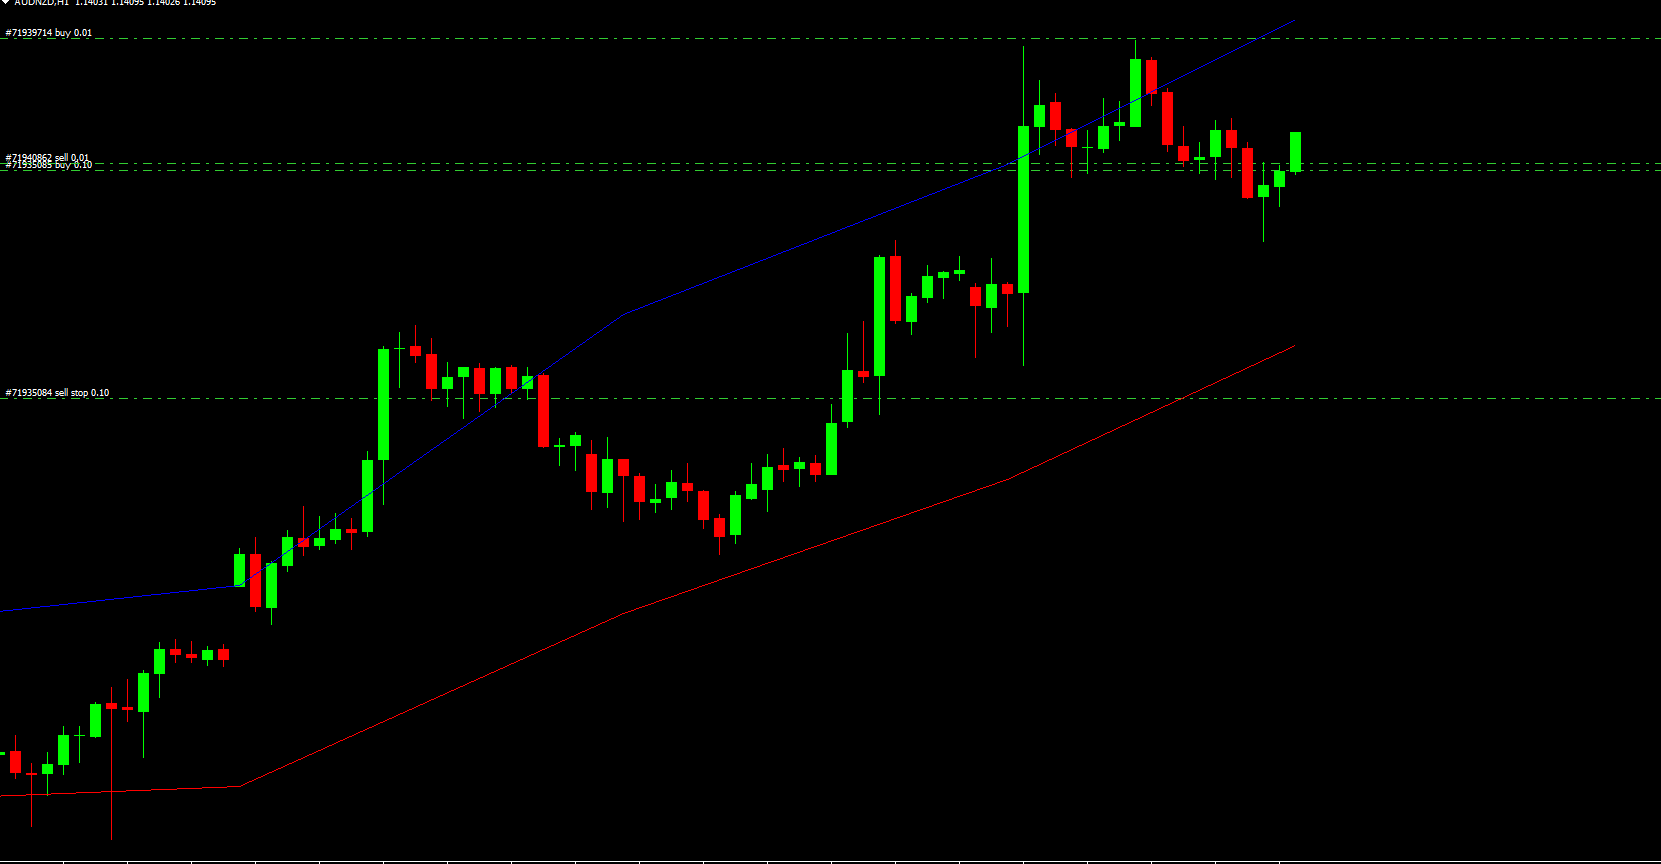
Example of Dyn Range Indicator in Action
Consider the GBP/USD H1 chart:
The price rejected the upper Dyn Range, forming a bearish pin bar — a sell signal.
Later, a bullish pin bar at the lower Dyn Range confirmed a buy entry.
This example demonstrates how traders can rely on dynamic resistance and support levels to make well-timed decisions in trending or ranging markets.
Why Use the Dyn Range Indicator for MT4?
Improves Risk Management: Identifies key zones for stop loss and take profit placement.
Adapts to All Market Conditions: Works in both trending and sideways markets.
Enhances Strategy Accuracy: Supports Scalping, day trading, and swing trading styles.
Compatible with Other Indicators: Can be combined with RSI, MACD, or Moving Averages for confluence.
By incorporating the Dyn Range Indicator into your trading system, you can anticipate market behavior more effectively and reduce emotional decision-making.
Conclusion
The Dyn Range Indicator for MT4 is a versatile and reliable tool for traders looking to understand real-time Market Structure. It not only identifies potential buy and sell opportunities but also provides insights into overall trend direction and market sentiment.
Whether you’re a beginner or an advanced trader, using the Dyn Range alongside other analytical tools will help you create a comprehensive trading plan and improve profitability.
👉 Download the Dyn Range Indicator for MT4 now at IndicatorForest.com and take your forex trading strategy to the next level!
FAQ
2 Downloads
Published:
Dec 21, 2025 23:39 PM
Category: