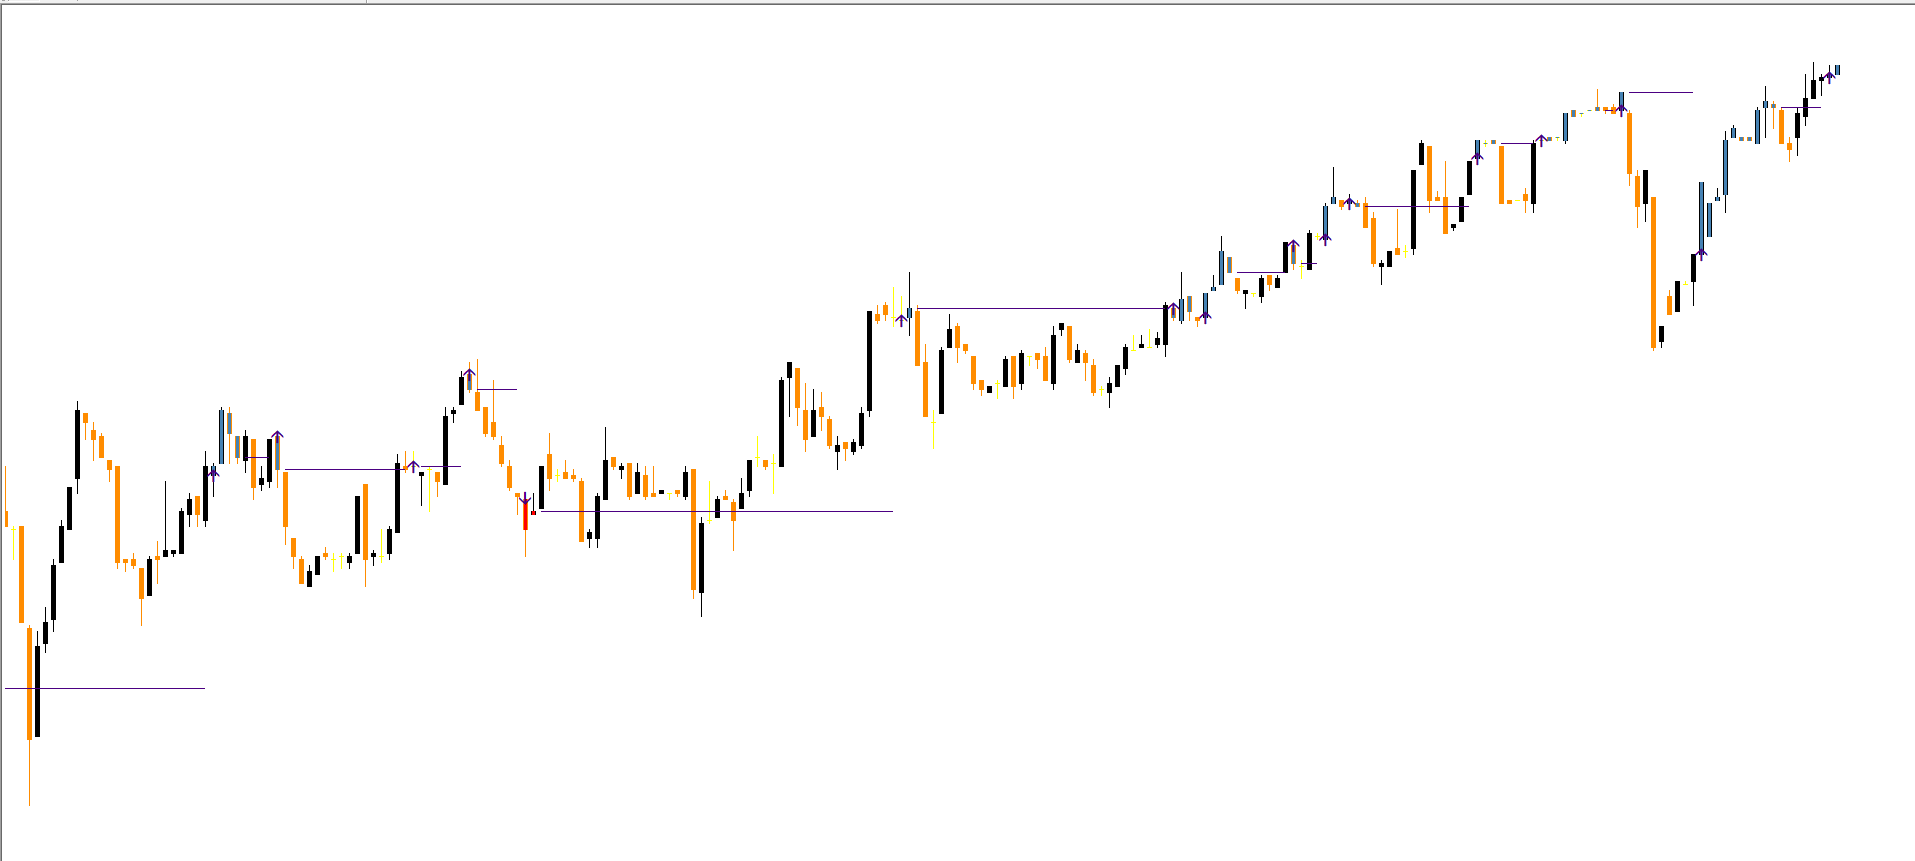
The Easy Trend Visualizer indicator for MetaTrader 4 is a powerful trend-tracking tool designed for traders who rely on visual clarity in market analysis. This Easy Trend Visualizer indicator uses three ADX calculations to display arrows and horizontal bars, helping traders identify trend beginnings, trend reversals, and trend exhaustion points. The indicator aims to simplify technical analysis, making it suitable for beginners, intermediate traders, and experienced market participants.
On IndicatorForest.com, you can download the Easy Trend Visualizer indicator completely free and use it in your daily trading workflow.
What Is the Easy Trend Visualizer Indicator?
The Easy Trend Visualizer indicator for MT4 combines Average Directional Index (ADX) readings to determine the strength and direction of market trends. Unlike ordinary ADX tools, this version includes:
Trend-confirmation arrows
Horizontal bar signals
Clear buy/sell markers
Visual end-of-trend indications
These visual cues enable traders to understand when a trend is forming, when it is slowing down, and when it is reversing.
Key Features of the Easy Trend Visualizer Indicator
ADX-Based Trend Detection
The indicator uses multiple ADX values to assess market Trend Strength. This method helps identify high-probability trade entries.
Buy and Sell Arrows
Arrows mark areas where a potential new trend may begin. These act as possible buy and sell signals.
Horizontal Bars for Trend Exhaustion
Horizontal bars indicate where the trend might be reaching its end. This helps traders prepare for exits or reversals.
Suitable for All Trading Styles
The Easy Trend Visualizer indicator is an excellent tool for:
Scalpers
Intraday/day traders
Swing traders
Trend-followers
Price Action traders
How to Trade Using the Easy Trend Visualizer Indicator
The indicator works best when paired with price action. Below is a practical breakdown based on how traders typically use this tool on pairs like AUDUSD.
Identifying Buy Setups
A buy signal occurs when a bullish arrow appears and price is already positioned to move upward. For example, if the market forms higher lows or a bullish engulfing pattern, the signal becomes stronger.
Identifying Sell Setups
Sell signals appear when bearish arrows form at a resistance level or during bearish candlestick formations such as double tops, pin bars, or bearish engulfing candles.
Trade Management
Traders can use:
Trend bars as exit confirmation
ADX readings for trend strength
Price action as a secondary filter
This combination improves reliability and reduces false signals during low-volume market conditions.
Why Traders Use the Easy Trend Visualizer
The Easy Trend Visualizer indicator for MetaTrader gives a clean visual overview of the market. Its trend arrows and horizontal bars minimize confusion and help traders make faster decisions. Whether you're new to Forex or already trading full-time, this indicator simplifies both trend detection and trade timing.
Conclusion
The Easy Trend Visualizer indicator for MT4 is a practical and effective tool for traders looking to identify trend beginnings and exits with greater accuracy. Its ADX-based visualization system makes it ideal for Scalping, day trading, and swing trading. You can download the indicator for free and explore more tools on IndicatorForest.com.
FAQ
Published:
Nov 14, 2025 21:23 PM
Category: