Unlocking Market Rhythm with the Ehlers Cyber Cycle Indicator
To succeed in financial trading, accurate market timing is critical. Standard momentum tools like the Relative Strength Index (RSI) or Stochastics often struggle to keep up because they use fixed boundaries or smoothing processes that introduce significant lag. During quick market reversals, this lag can result in late entries or missed opportunities. To overcome this limitation, legendary technical analyst John Ehlers introduced a advanced technical indicator known as the Ehlers Cyber Cycle.
What is the Ehlers Cyber Cycle?
The Ehlers Cyber Cycle is an advanced momentum oscillator designed to isolate the dominant cyclical wave component of price movements from the underlying trend. First detailed in his groundbreaking book, Cybernetic Analysis for Stocks and Futures, Ehlers utilized advanced digital signal processing (DSP) concepts to model market data as clear mathematical frequencies.
Unlike traditional oscillators that track fixed ranges, the Cyber Cycle measures price movements with variable amplitudes. The math behind the indicator involves a multi-tiered smoothing formula. It first extracts a weighted median price, then runs a second-order difference calculation using a specific smoothing factor:
$$\text{Smooth}_i = \frac{\text{Price}_i + 2 \cdot \text{Price}_{i-1} + 2 \cdot \text{Price}_{i-2} + \text{Price}_{i-3}}{6}$$
$$\text{Cycle}_i = (1 - 0.5\alpha)^2 \cdot (\text{Smooth}_i - 2 \cdot \text{Smooth}_{i-1} + \text{Smooth}_{i-2}) + 2(1 - \alpha) \cdot \text{Cycle}_{i-1} - (1 - \alpha)^2 \cdot \text{Cycle}_{i-2}$$
By applying this DSP framework, the indicator effectively eliminates short-term market noise while maintaining an extremely low-lag profile, giving traders a real-time window into upcoming cycle changes.
Interpreting the Visual Signals
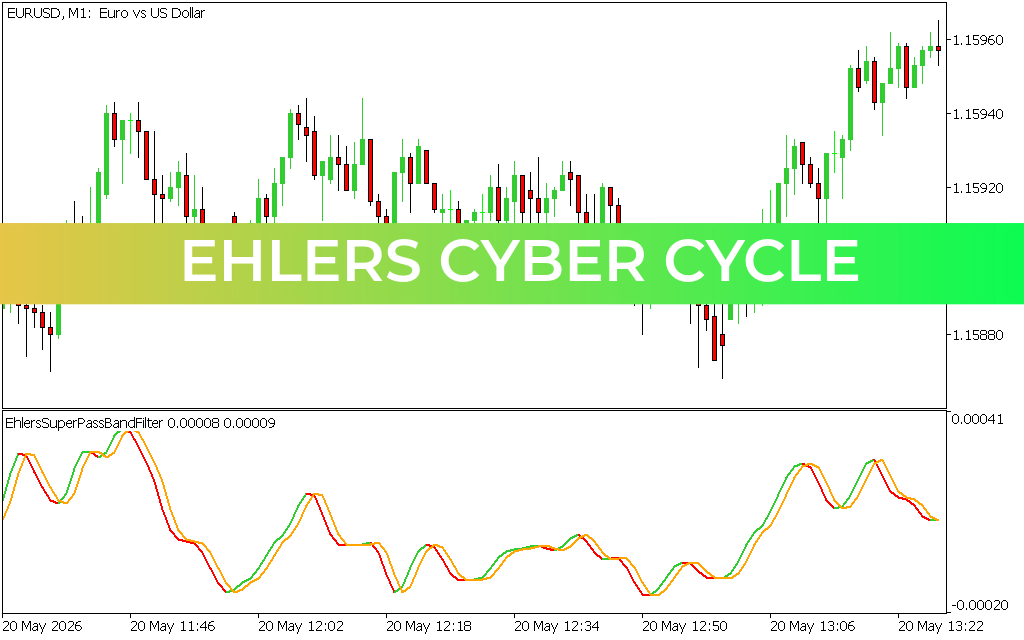
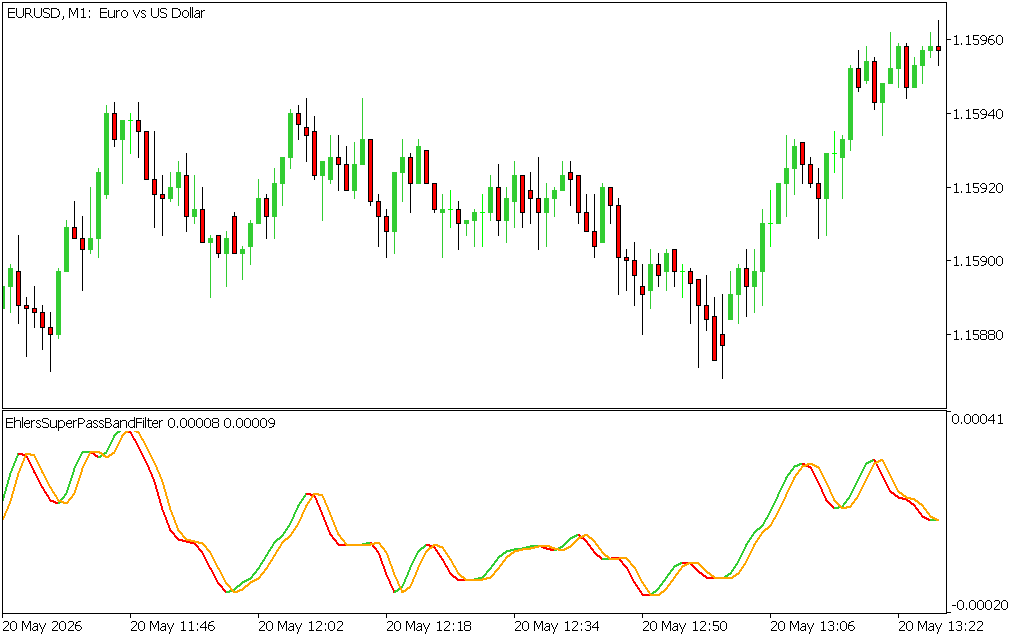
When plotted on short-term charts, such as an intraday 1-minute (M1) or 5-minute (M5) frame, the Ehlers Cyber Cycle populates a dedicated sub-window beneath the main price grid. The interface consists of two fast-moving lines: the main Cycle Line and a shifted Trigger Line.
- Bullish Reversals (Upward Crossovers): When the faster Cycle Line crosses cleanly above the slower Trigger Line from underneath, it indicates that a cyclical market trough has formed. This signal suggests that selling pressure is exhausted and a high-probability upward reversal is beginning.
- Bearish Reversals (Downward Crossovers): When the Cycle Line crosses below the Trigger Line from above, it indicates a cyclical peak. This crossover alerts traders to lock in profits or prepare for short setups.
- Zero-Line Intersections: The zero line marks the baseline of market equilibrium. A decisive push above zero confirms growing bullish momentum, while a break below zero highlights expanding bearish flow.
Key Trading Applications
To unlock the maximum statistical probability from the Ehlers Cyber Cycle, implement it with structured execution filters:
- Cycle and Trend Confluence: In a strong macro uptrend, disregard standard peak crossovers. Instead, use deep troughs below the zero line as precision entry points to join the dominant move on pullbacks.
- Divergence Detection: If the price prints a fresh lower low but the Cyber Cycle forms a higher low, it signals hidden institutional buying and foreshadows an explosive trend change.
By filtering out market noise without lagging behind real-time price changes, the Ehlers Cyber Cycle acts as an indispensable tool for systematic, rule-based execution.g tools.
1 Download
Last Update:
May 21, 2026 02:39 AM
Published:
Jan 18, 2026 13:50 PM
Category: