A well-planned exit strategy is as crucial as identifying entry points in trading. Many traders can spot profitable trades but fail to secure gains due to market reversals. The Exit Indicator for MT4 is a free tool designed to help traders close positions at optimal points, minimizing losses and maximizing profits.
The indicator operates on a simple premise: price tends to reverse after moving against the prevailing trend for an extended period. It is versatile, suitable for any asset, all timeframes, and various trading strategies, including swing trading and Scalping.
How the Exit Indicator Works
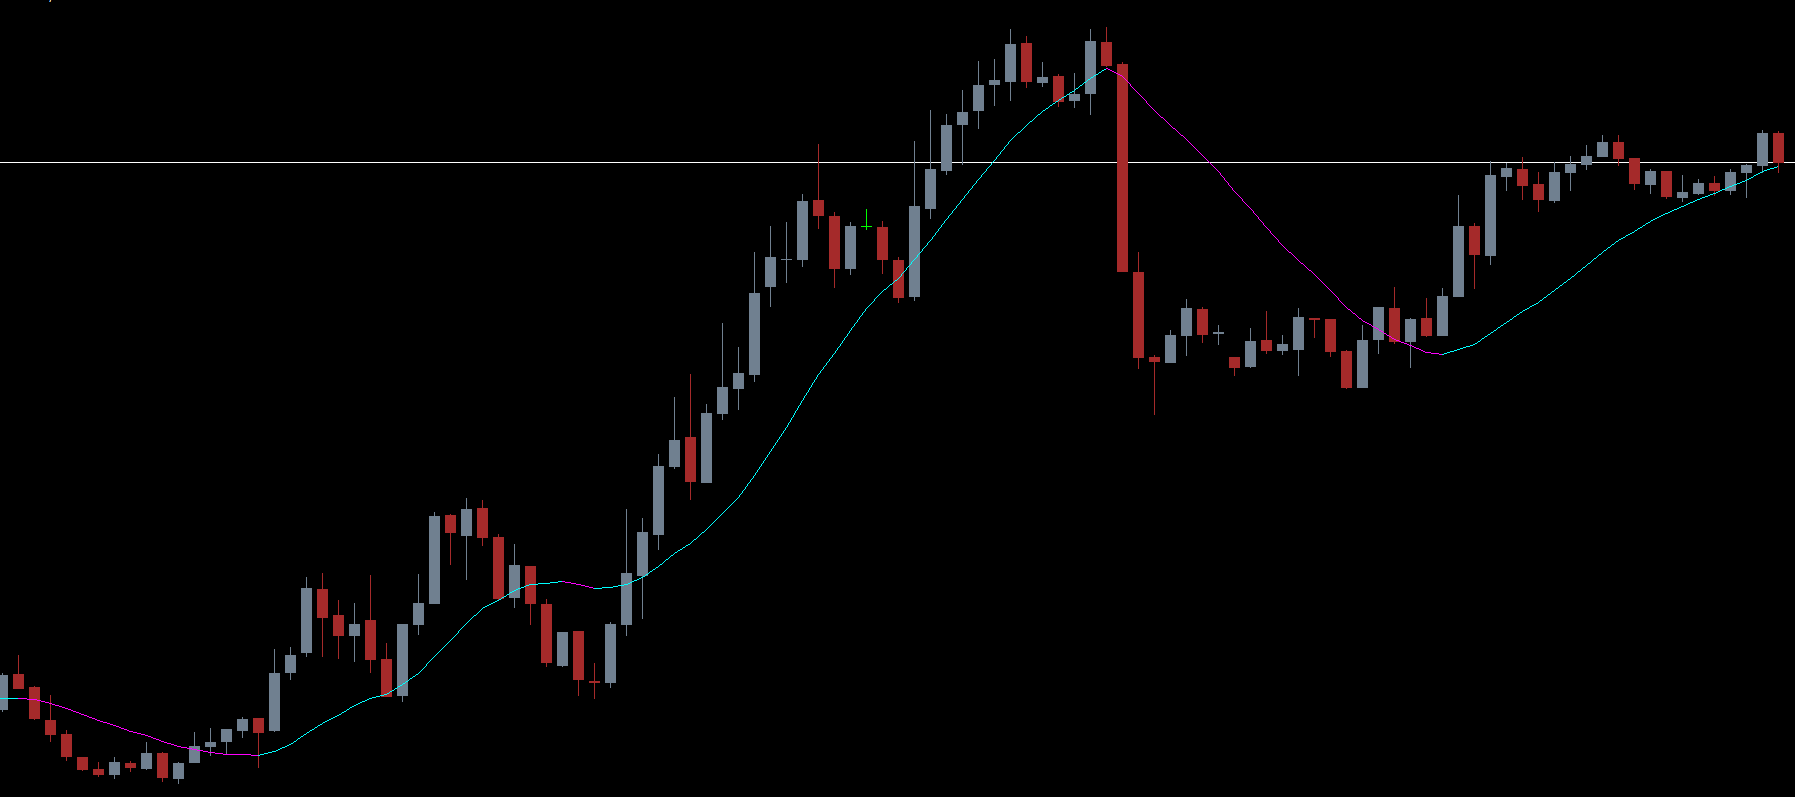
The Exit Indicator displays colored lines relative to the price candlesticks to indicate trend direction and potential reversal points.
Buy signal: When the indicator line appears below the candlestick, the market is in an uptrend. The line is aqua during bullish momentum.
Sell signal: When the line appears above the candlestick, the market is in a downtrend. The line is magenta during bearish momentum.
The indicator helps traders identify not just entry points but, more importantly, exit points, ensuring trades are closed before adverse reversals erode profits.
Exiting Trades Using the Indicator
Exiting a Buy Trade
For long positions, the exit is signaled when the aqua line changes to magenta. This color shift indicates a potential reversal from bullish to bearish momentum. Traders can also use the magenta line as a dynamic stop-loss, placing it several pips below the indicator line to protect gains.
Exiting a Sell Trade
For short positions, exit when the magenta line turns aqua, signaling a trend shift from bearish to bullish. This helps traders catch impending reversals and close trades at optimal levels.
Chart Example
On a EUR/USD chart, the Exit Indicator demonstrates:
During an uptrend, the aqua line appears below candlesticks, acting as dynamic support. Even if the price tests this line, it often bounces unless bearish momentum becomes strong.
During a downtrend, the magenta line appears above candlesticks, acting as resistance. When the price crosses this line, it signals a potential Trend Reversal, prompting traders to exit sell positions.
The visual cues provided by line color changes make trade management straightforward, helping traders lock profits and manage risk effectively.
Advantages of the Exit Indicator
Simple to use: Clear buy and sell trend visualization.
Dynamic exit points: Provides real-time signals for closing trades.
Risk management: Lines act as dynamic stop-loss levels.
Versatile: Works on all timeframes and assets.
Free download: Fully accessible for MT4 users.
Conclusion
The Exit Indicator for MT4 is an essential tool for trade management and profit locking. By tracking trend direction and highlighting potential reversals, it helps traders exit positions at the optimal time. The color-changing lines offer both visual guidance and dynamic stop-loss placement.
Whether you are a novice or an experienced trader, the Exit Indicator ensures that you do not leave profits on the table and can manage trades effectively. Download the indicator for free today from IndicatorForest.com and take your trade exits to the next level.
FAQ
3 Downloads
Published:
Nov 26, 2025 01:44 AM
Category: