The Extreme RSI Indicator for MT4 is an enhanced version of the traditional Relative Strength Index (RSI), designed to identify strong trends with high clarity. Instead of focusing on overbought or oversold levels like the classic RSI, this upgraded tool plots blue arrows on the chart to signal potential bullish or bearish momentum.
Its simplicity and non-repainting nature make it an excellent choice for traders who prefer clean and direct signals. The indicator works across all timeframes, but it performs best on higher timeframes where Trend Strength is more reliable.
How to Use the Extreme RSI Indicator for MT4
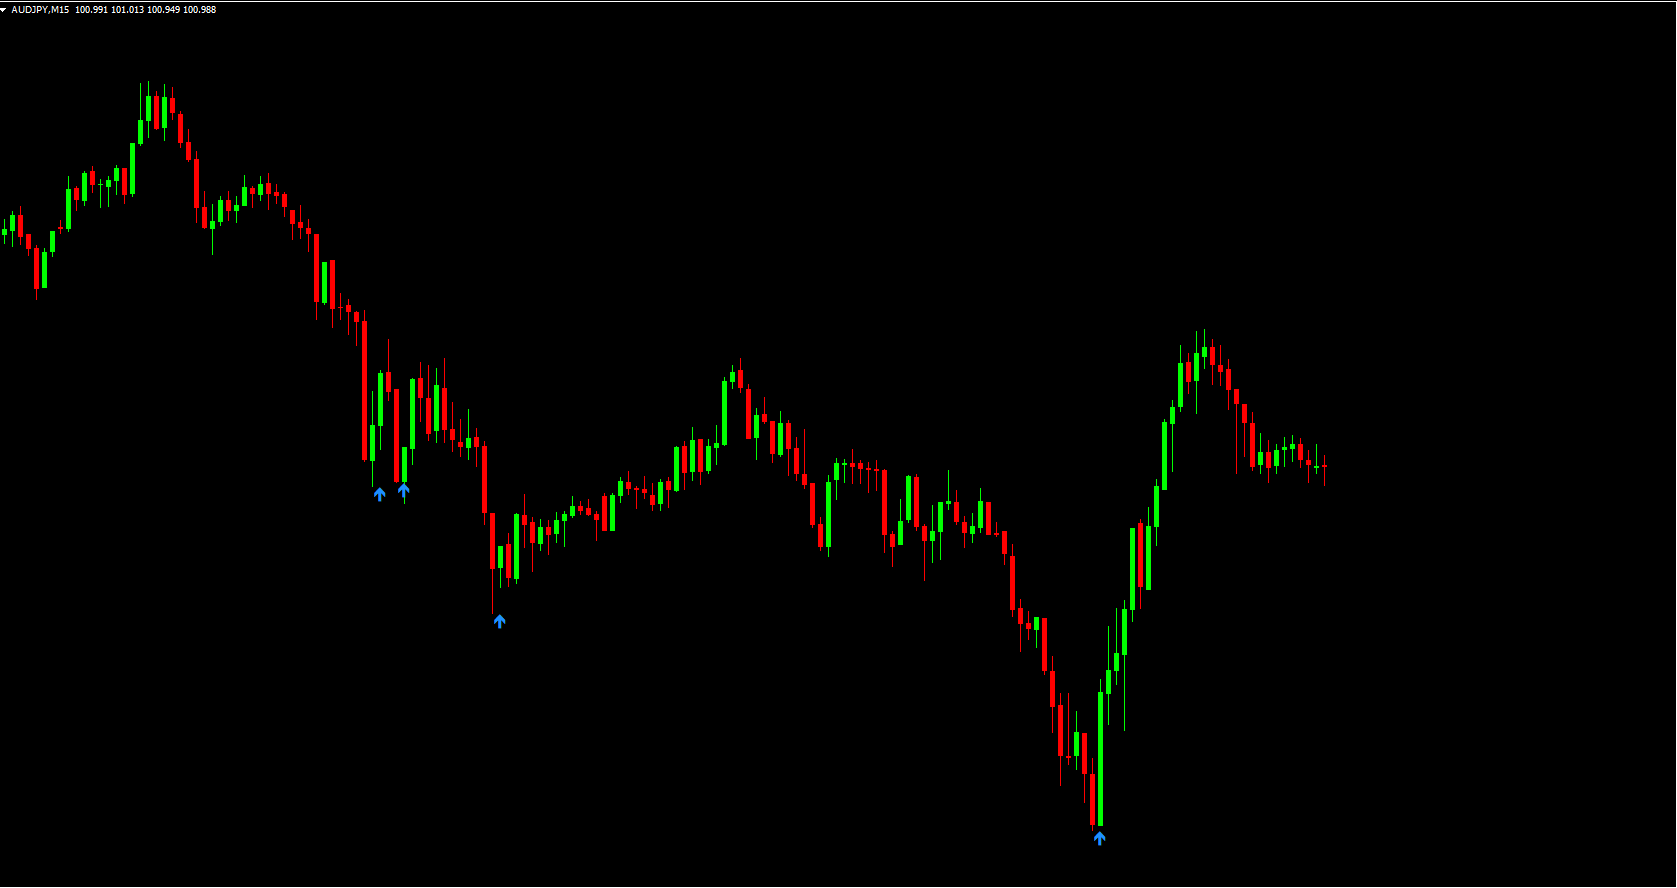
The example shown on the GBP/CHF H4 chart illustrates how BUY and SELL setups are generated.
Buy Signals
The indicator prints a blue upward arrow on a bullish candle.
This arrow indicates a strong bullish trend or a continuation of upward momentum.
Traders may enter a BUY position when the arrow aligns with Price Action (e.g., bullish engulfing, break of structure).
Sell Signals
The indicator prints a blue downward arrow on a bearish candle.
This suggests a strong bearish trend or continuation of downward momentum.
Traders may enter a SELL position when the signal aligns with bearish confirmation (e.g., bearish engulfing or retest rejection).
Important Notes
The Extreme RSI Indicator does not identify overbought/oversold zones, unlike the traditional RSI.
It is a non-repainting indicator, meaning signals do not disappear after appearing.
During powerful trends, the indicator may display multiple arrows, signaling continued momentum.
Occasionally, the tool may plot arrows during short-term price movements, so it’s best used alongside other indicators or price action strategies for confirmation.
Conclusion
The Extreme RSI Indicator for MT4 is a powerful upgrade to the standard RSI, providing clean and reliable entry signals during strong trends. Its non-repainting signals and simple arrow-based interface make it beginner-friendly, while advanced traders can use it as a confluence tool for more precise entries.
You can download the Extreme RSI Indicator for free from our website and start integrating it into your trading strategy today.
FAQ
4 Downloads
Published:
Dec 20, 2025 23:43 PM
Category: