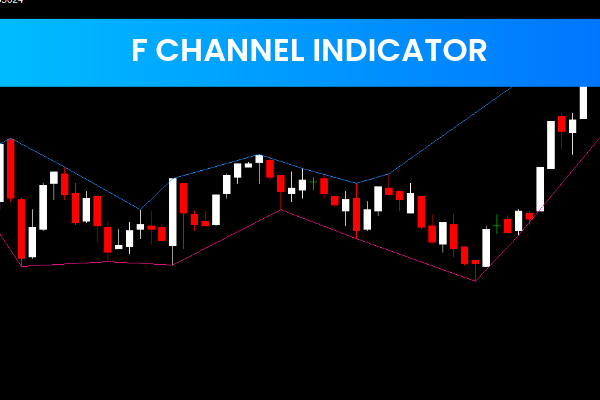
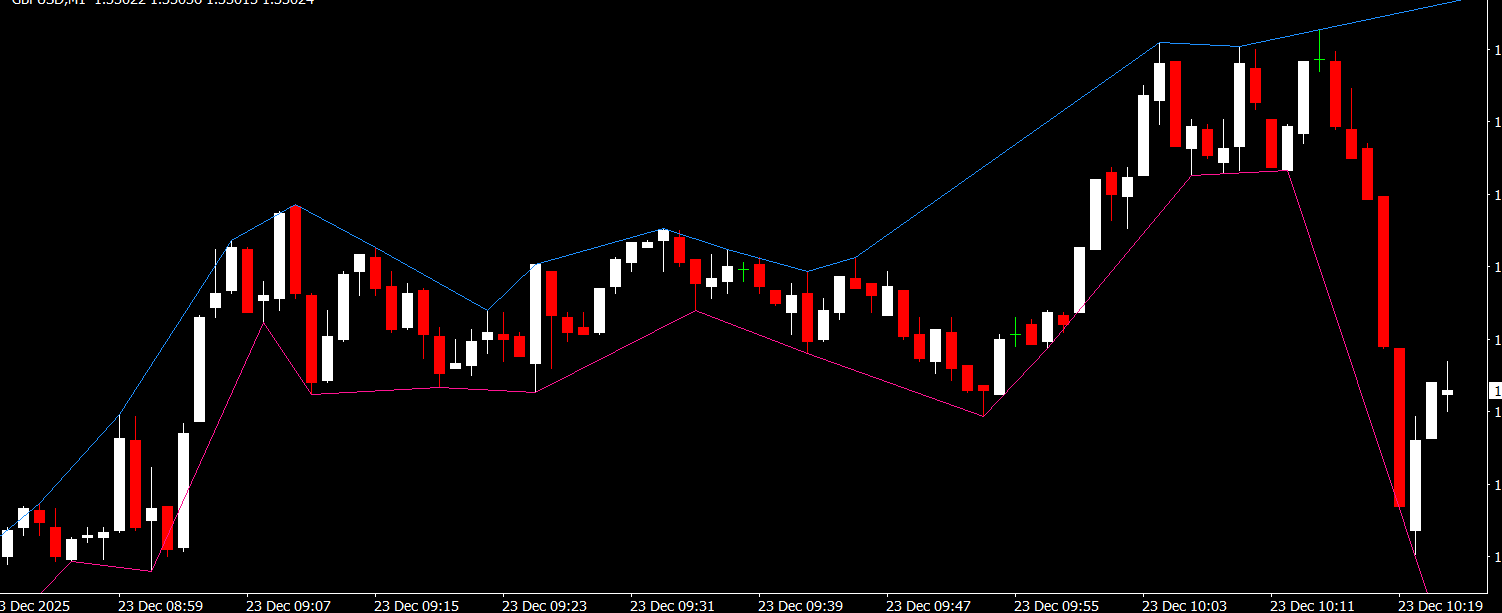
The F-Channel Indicator is a free and popular MT4 Forex Indicator that helps traders identify potential areas of Support And Resistance. By analyzing price movements within a channel formed by moving averages, this indicator provides clear visual signals that can assist in making more informed trading decisions.
How the F-Channel Indicator Works
The F-Channel Indicator is based on the concept of price channels, which occur when the price moves between two parallel lines of support and resistance. The indicator uses exponential moving averages (EMAs) to calculate these levels:
Upper Channel Line: Represents the potential resistance level.
Lower Channel Line: Represents the potential support level.
Channel Breaches: Visual signals alert traders when the price crosses the channel boundaries, signaling potential trade opportunities.
By monitoring these channel lines, traders can identify potential breakout points and reversal zones.
Key Features of the F-Channel Indicator
Identifies support and resistance levels using EMAs
Displays visual alerts when price breaches the channel
Helps traders spot trend reversals and breakout opportunities
Free and compatible with MT4
Suitable for novice and experienced traders alike
Using the F-Channel Indicator in Trading
Trend Analysis
The F-Channel Indicator allows traders to quickly assess the trend direction. When the price stays near the upper channel line, the market is showing strength, while prices near the lower line indicate weakness.
Entry and Exit Points
Traders can use the F-Channel to:
Enter trades when the price rebounds from the support or resistance levels
Exit trades when the price reaches the opposite side of the channel
Confirm breakouts when the price breaches the channel lines
Risk Management
By providing clear support and resistance levels, the F-Channel Indicator helps traders set stop-loss and take-profit orders effectively, reducing risk exposure and improving trade management.
Benefits of Using the F-Channel Indicator
Provides a clear visual guide for market trends
Assists in identifying high-probability trading opportunities
Works on any timeframe or currency pair
Easy to install, use, and interpret
Enhances overall trading strategy with reliable signals
Final Thoughts
The F-Channel Indicator is a versatile and powerful MT4 tool that helps traders identify key levels of support and resistance. By using EMAs to form price channels and providing visual signals for breaches, it offers a straightforward method to improve trading decisions.
👉 Visit IndicatorForest.com to download the F-Channel Indicator and explore more free MT4 tools to enhance your Forex trading strategie
FAQ
Published:
Dec 23, 2025 04:26 AM
Category: