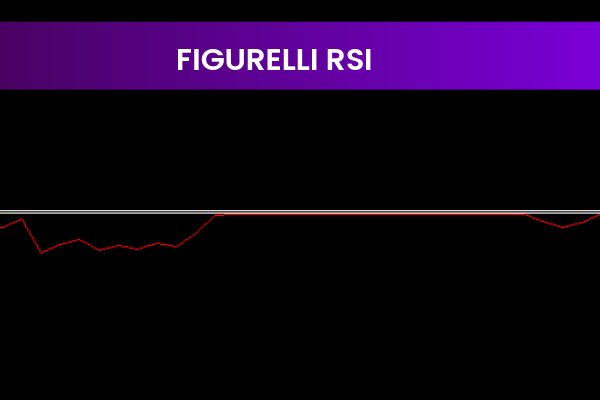
The Figurelli RSI Indicator is a powerful and widely used Forex trading tool designed for the MT4 platform. It is free to download, easy to install, and highly effective for traders who want a clearer view of market momentum. By displaying the Relative Strength Index in histogram form and applying a unique smoothing algorithm, this indicator helps traders reduce market noise and focus on meaningful price movements.
Momentum analysis plays a critical role in Forex trading, and the Figurelli RSI Indicator simplifies this process by transforming traditional RSI data into an easy-to-read visual format. This makes it an excellent choice for both beginner and experienced traders.
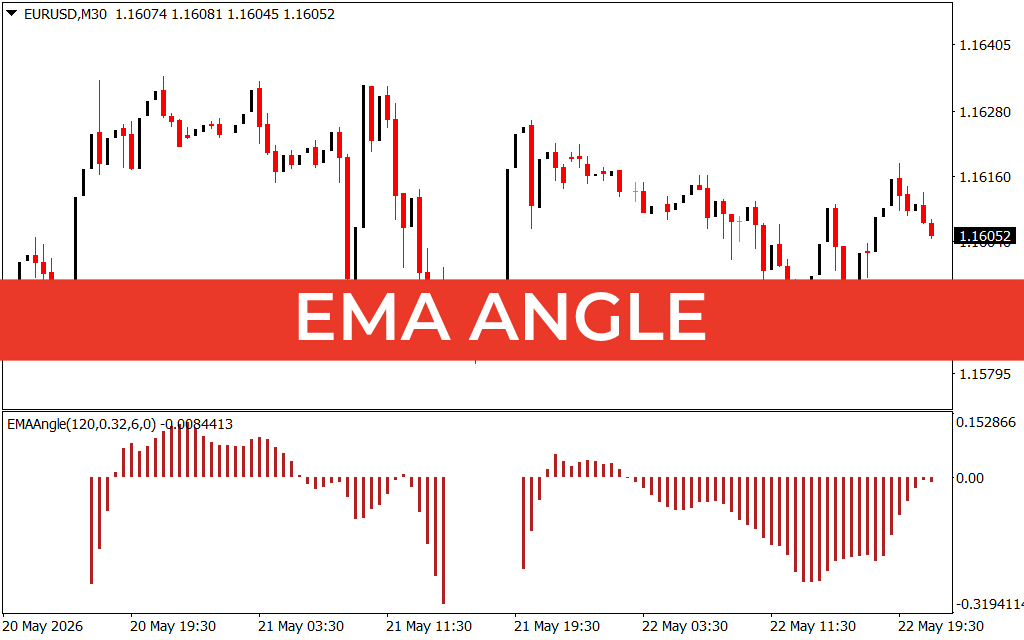
How the Figurelli RSI Indicator Works
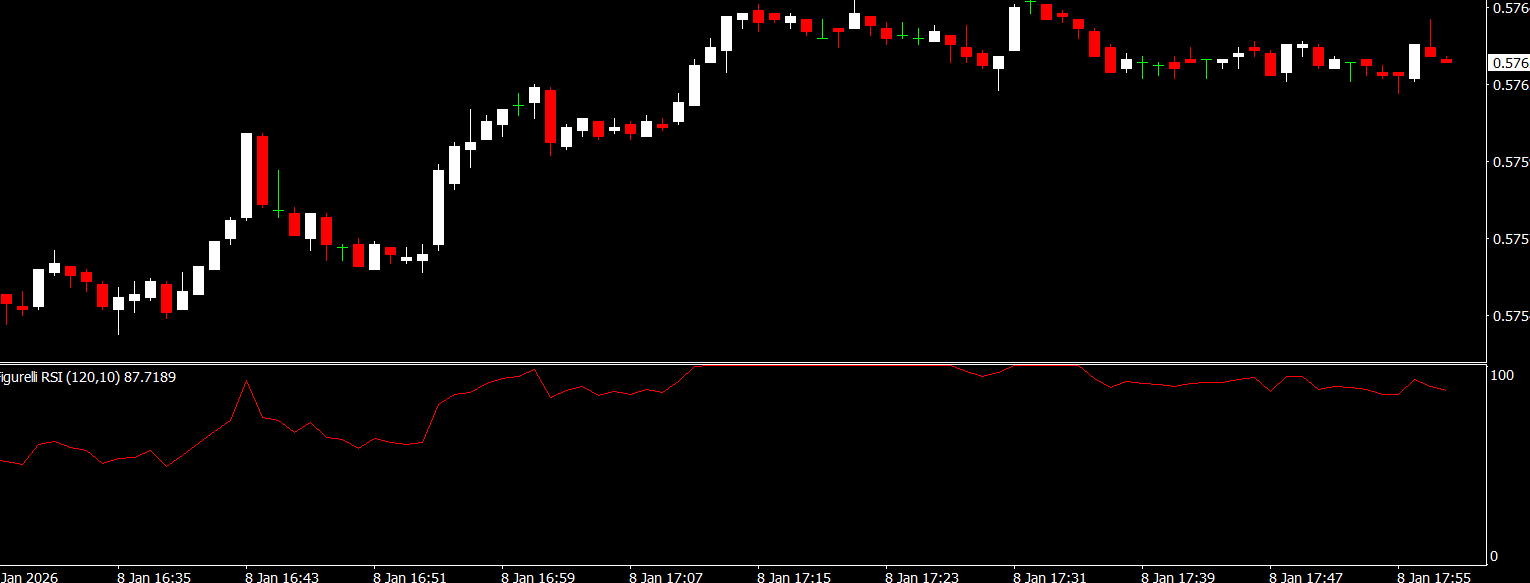
The indicator tracks price momentum by calculating the Relative Strength Index and plotting it as a histogram instead of a standard line. This histogram format makes it easier to see changes in momentum and Trend Strength.
A key feature of the Figurelli RSI Indicator is its smoothing algorithm. This smoothing reduces false signals caused by short-term price fluctuations and provides a clearer picture of the underlying market trend.
As momentum increases, the histogram expands, signaling stronger trend conditions. When momentum weakens, the histogram contracts, which may indicate consolidation or a possible reversal.
Identifying Overbought and Oversold Conditions
One of the primary uses of the Figurelli RSI Indicator is identifying overbought and oversold market conditions. When the histogram reaches extreme levels, it may suggest that price is stretched and a correction or reversal could occur.
These signals help traders avoid entering trades too late and assist in spotting high-probability reversal zones.
Support And Resistance Insights
In addition to momentum analysis, the Figurelli RSI Indicator can help identify potential support and resistance areas. Repeated histogram reactions around certain levels may highlight price zones where buying or selling pressure is strong.
This feature is especially useful when combined with Price Action or horizontal support and resistance analysis.
Best Use for Swing Trading
The Figurelli RSI Indicator is particularly popular among swing traders. It helps identify potential entry and exit points by highlighting momentum shifts that often occur before price reversals.
Swing traders can use the indicator to:
Time entries during pullbacks
Exit trades when momentum weakens
Confirm trend continuation
It can also be combined with moving averages, trendlines, or other MT4 indicators for stronger confirmation.
Benefits of Using the Figurelli RSI Indicator
RSI displayed as a clear histogram
Smoothed signals reduce market noise
Identifies overbought and oversold levels
Helps detect momentum shifts early
Useful for support and resistance analysis
Free and compatible with MT4
Because of its flexibility, the indicator works well across multiple timeframes and currency pairs.
How to Install and Use
To install the Figurelli RSI Indicator on MT4:
Download the indicator from IndicatorForest.com
Open MT4 and select “File > Open Data Folder > MQL4 > Indicators”
Paste the indicator file into the folder
Restart MT4 and attach the indicator to your chart
Once installed, the indicator will automatically calculate and display momentum data in real time.
Why Traders Choose the Figurelli RSI Indicator
Traders prefer the Figurelli RSI Indicator because it simplifies RSI analysis while improving signal clarity. Its histogram format and smoothing algorithm make it easier to interpret momentum and avoid false entries.
To explore more free and professional MT4 indicators, visit IndicatorForest.com and discover tools that can improve your trading performance.
Conclusion
The Figurelli RSI Indicator is a free, reliable, and easy-to-use Forex Indicator for MT4 traders. By displaying RSI as a smoothed histogram, it provides a clearer view of momentum, overbought and oversold levels, and potential entry and exit points. Download it today from IndicatorForest.com and enhance your Forex trading strategy.
1 Download
Published:
Jan 08, 2026 22:11 PM
Category: