Anticipate Market Turning Points with the Forecast Oscillator Indicator
Following a market trend after it has already established itself often causes retail traders to enter trades late, reducing their potential profit margins. Standard lagging indicators like basic moving averages only confirm price direction after a substantial move has occurred. For short-term scalpers and day traders operating on highly active pairs like the EUR/USD, catching early momentum shifts is essential. The Forecast Oscillator indicator is designed to solve this issue by utilizing advanced linear regression calculations to predict future price extensions.
What is the Forecast Oscillator Indicator?
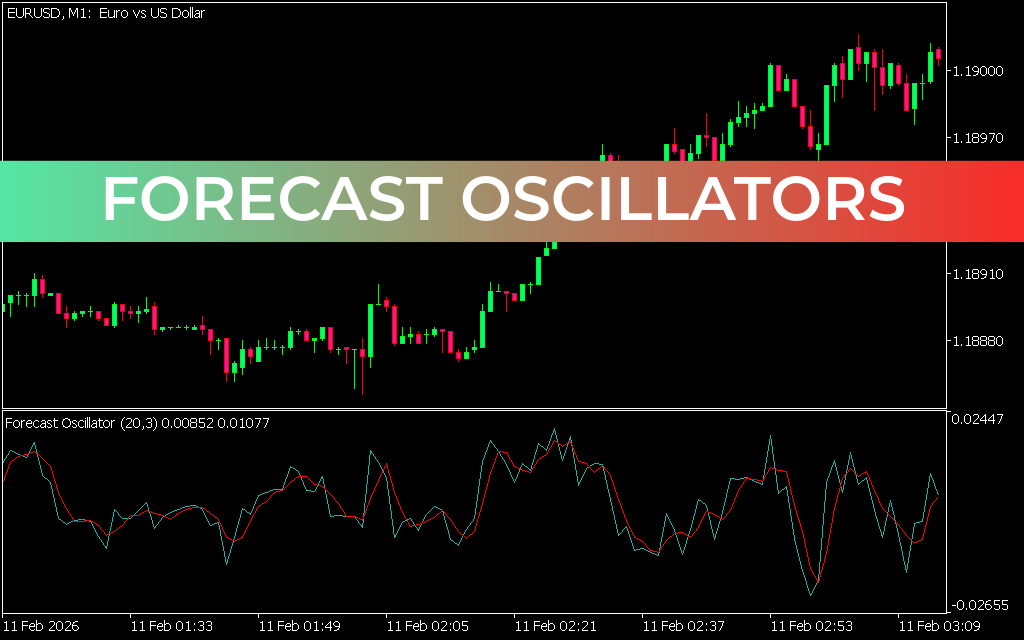
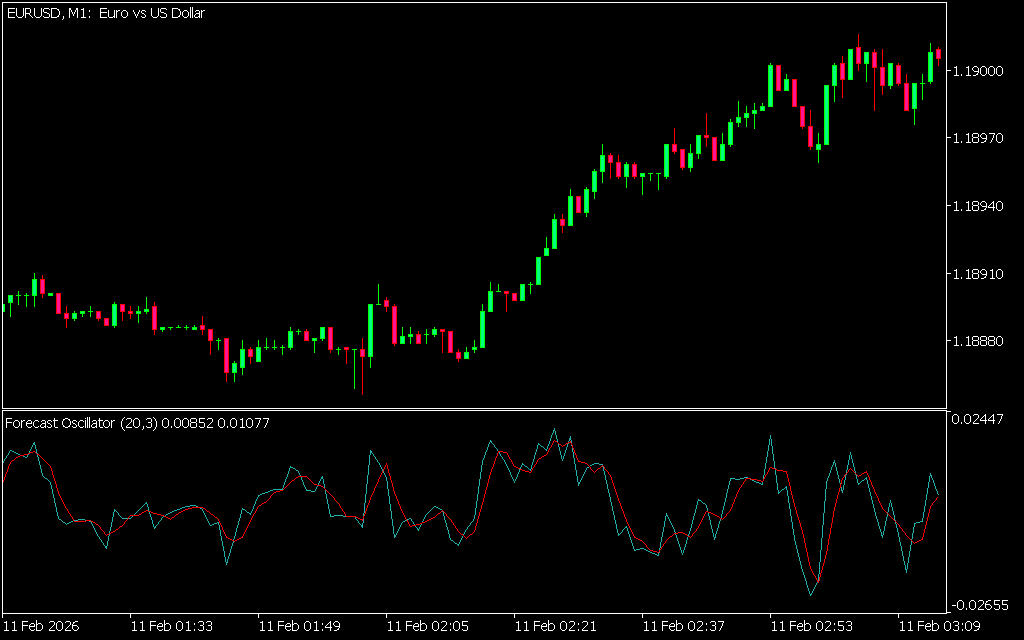
The Forecast Oscillator is a sophisticated momentum tool engineered for modern charting platforms like MetaTrader. It operates by mathematically comparing the current closing price of an asset directly against its calculated linear regression forecast price (often utilizing a standard 20-period baseline).
Instead of showing where the price has been, linear regression calculates an optimized mathematical line of best fit to determine where price should be based on recent velocity. The Forecast Oscillator then calculates the percentage deviation between the actual market close and this predictive baseline. If the real price surges significantly above the forecast line, the oscillator rises into positive territory; if it falls below, the oscillator drops into negative territory.
Key Visual Features and Technical Advantages
- Predictive Price Modeling: By anchoring its data to a linear regression curve rather than simple time-averages, it drastically reduces indicator lag during aggressive trend changes.
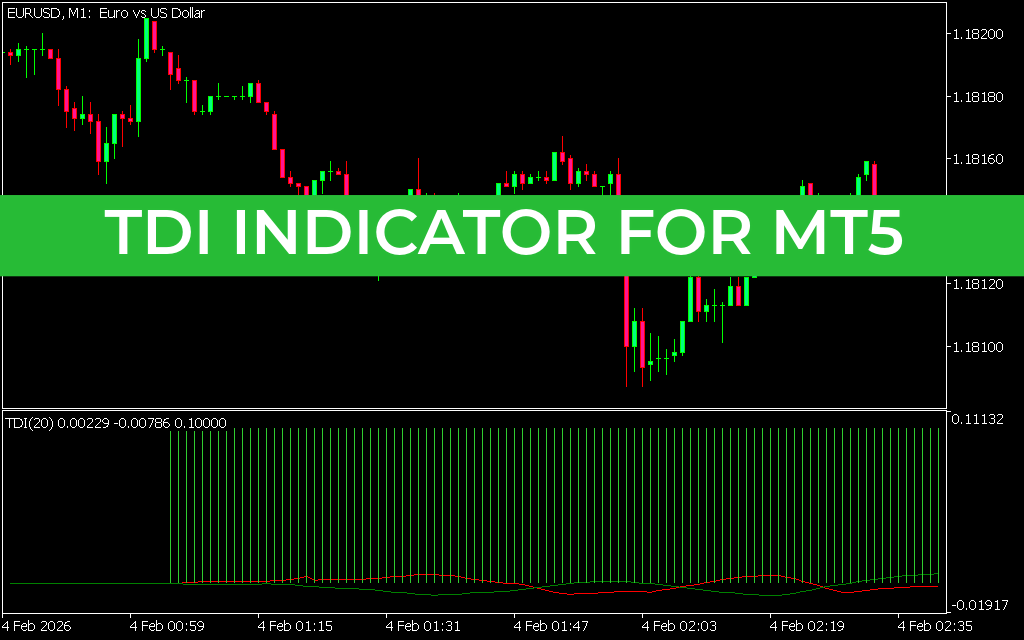
- Dual-Line Crossover Synergy: As displayed on quick 1-minute (M1) charts, the indicator features a fast-tracking line (blue) paired with a smoothed signal line (red). Crossovers between these lines highlight early momentum shifts before they reflect in standard candles.
- Zero-Line Equilibrium: The 0.00 baseline acts as a vital structural axis. When the oscillator sustains a position above zero, a powerful bullish expansion is confirmed. Positions below zero indicate strong bearish dominance.
- Compact Sub-Window Design: Operating within its own standalone panel beneath the primary workspace ensures your main candlesticks remain clear for charting support levels, trendlines, or structural order blocks.
How to Trade with the Forecast Oscillator
Using the Forecast Oscillator effectively centers on spotting price deviations from equilibrium and tracking quick line crossovers.
- Bullish Momentum Entry: Watch the indicator window during a market pullback or consolidation phase. When the fast blue line crosses decisively above the red signal line from beneath, it reveals that buyers are rapidly exceeding the model's regression expectations. Execute a buy trade as the lines cross above the 0.00 center axis to catch the initial breakout wave.
- Bearish Momentum Entry: Conversely, when the asset rallies into resistance and the fast blue line crosses below the red signal line, momentum has peaked. As the oscillator falls past the 0.00 baseline, sellers have seized control, marking a high-probability short entry with a stop-loss placed right above the local swing high.
Incorporate the Forecast Oscillator indicator into your technical toolkit today to eliminate lagging entry signals and trade with predictive precision.
Last Update:
May 19, 2026 16:38 PM
Published:
Jan 19, 2026 14:05 PM
Category: