Mastering Market Trends with the Fractal AMA Indicator
In the fast-paced world of Forex and stock trading, identifying a clear trend amidst market "noise" is often the difference between a winning streak and a depleted account. While standard moving averages are staples in any trader’s toolkit, they often suffer from significant lag or produce false signals during choppy Price Action. Enter the Fractal AMA (Adaptive Moving Average) Indicator, a sophisticated technical tool designed to bridge the gap between responsiveness and reliability.
What is the Fractal AMA Indicator?
The Fractal AMA is an advanced evolution of Perry Kaufman’s Efficiency Ratio-based adaptive moving average. Unlike a simple moving average (SMA) that treats all data points equally, the Fractal AMA uses fractal geometry principles to determine the current state of the market.
It calculates the "fractal dimension" of price movements over a specific period. When the market is trending strongly, the indicator becomes highly sensitive, tracking price closely to capture maximum profit. Conversely, when the market moves sideways or becomes volatile without direction, the Fractal AMA automatically smooths out, helping traders avoid the "whipsaw" effect of minor price fluctuations.
Key Benefits for Traders
- Reduced Lag: By adapting to price velocity, the Fractal AMA reacts faster to genuine trend reversals than traditional indicators.
- Noise Filtering: Its mathematical foundation allows it to ignore "market jitter," providing a cleaner visual representation of the underlying trend.
- Versatility: Whether you are Scalping the 1-minute chart or swing trading on the daily timeframe, the Fractal AMA adjusts its calculations to fit the volatility of your chosen instrument.
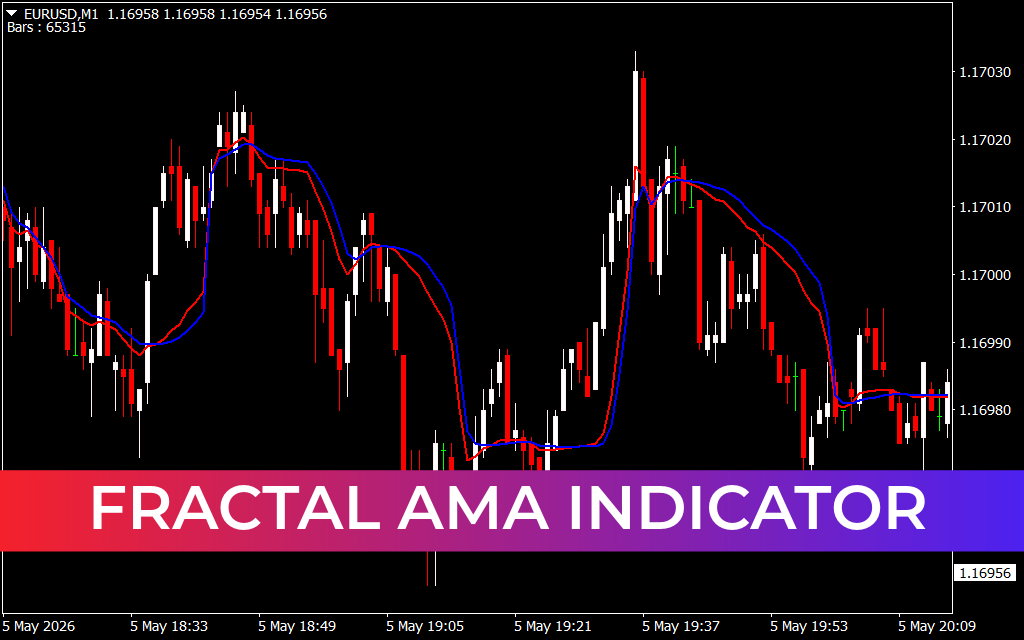
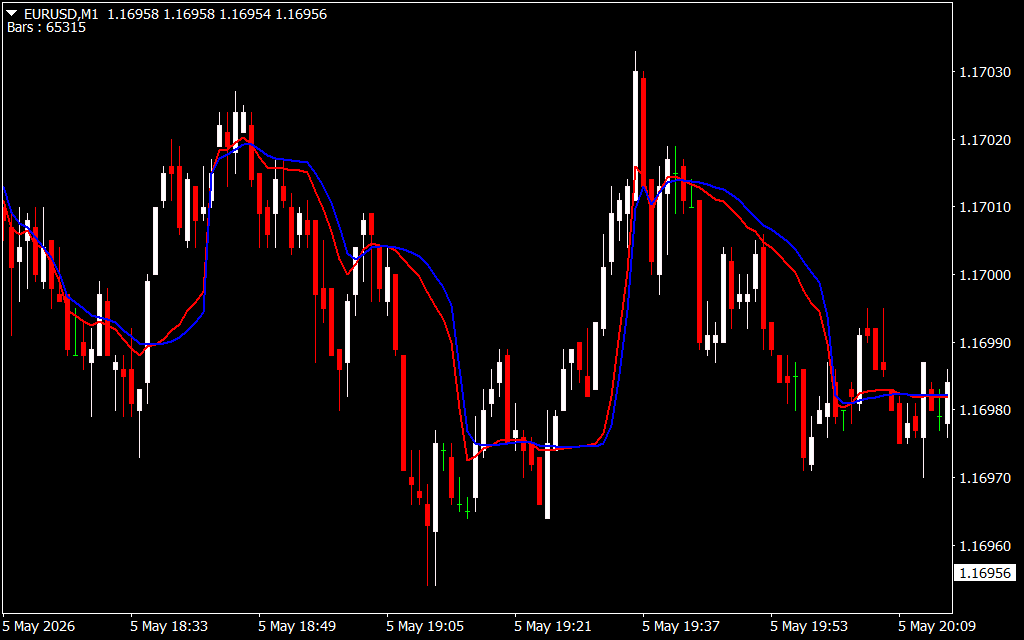
- Clear Visual Signals: Most versions of the indicator use color-coded lines or crossovers to signal bullish and bearish shifts, making it incredibly user-friendly for beginners.
Trading Strategies with Fractal AMA
The most effective way to use the Fractal AMA is as a trend-following filter. When the price is consistently above the AMA line and the line is sloping upward, the bias is bullish. Traders often look for "buy the dip" opportunities during these phases.
Additionally, the Fractal AMA excels when paired with momentum oscillators like the RSI or MACD. For instance, if the Fractal AMA signals a trend change and the RSI confirms increasing momentum, the probability of a successful trade increases significantly. It also serves as an excellent dynamic trailing stop-loss, moving closer to the price during explosive trends to protect your capital.
Conclusion
The Fractal AMA Indicator is more than just a line on a chart; it is an intelligent mathematical filter that respects the non-linear nature of financial markets. By incorporating fractal dimensions into your analysis, you gain a professional edge in distinguishing between a true breakout and a temporary spike.
2 Downloads
Last Update:
May 06, 2026 01:12 AM
Published:
Jan 27, 2026 13:29 PM
Category: