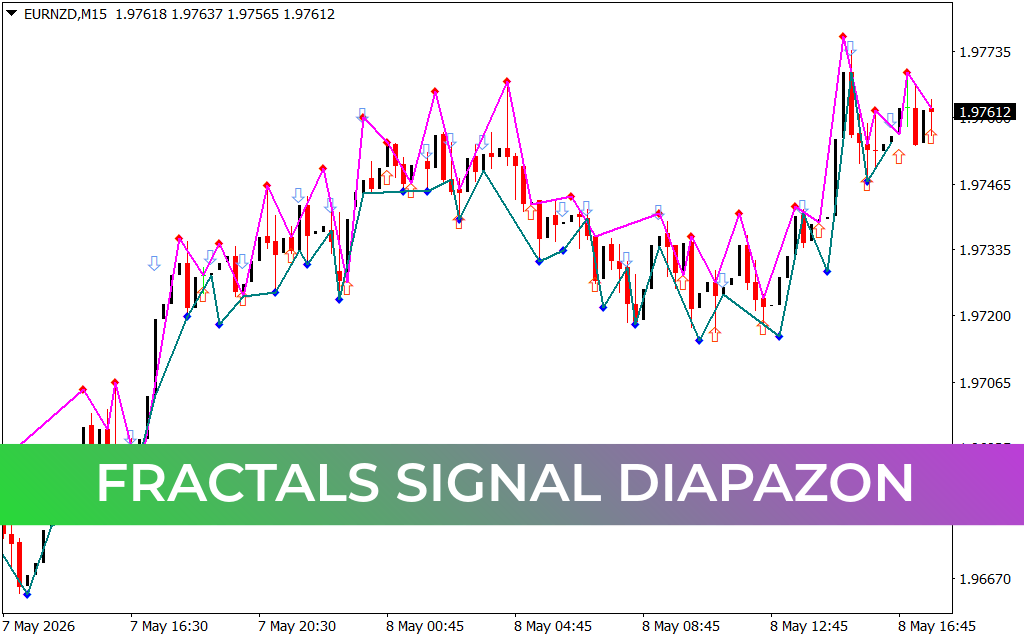
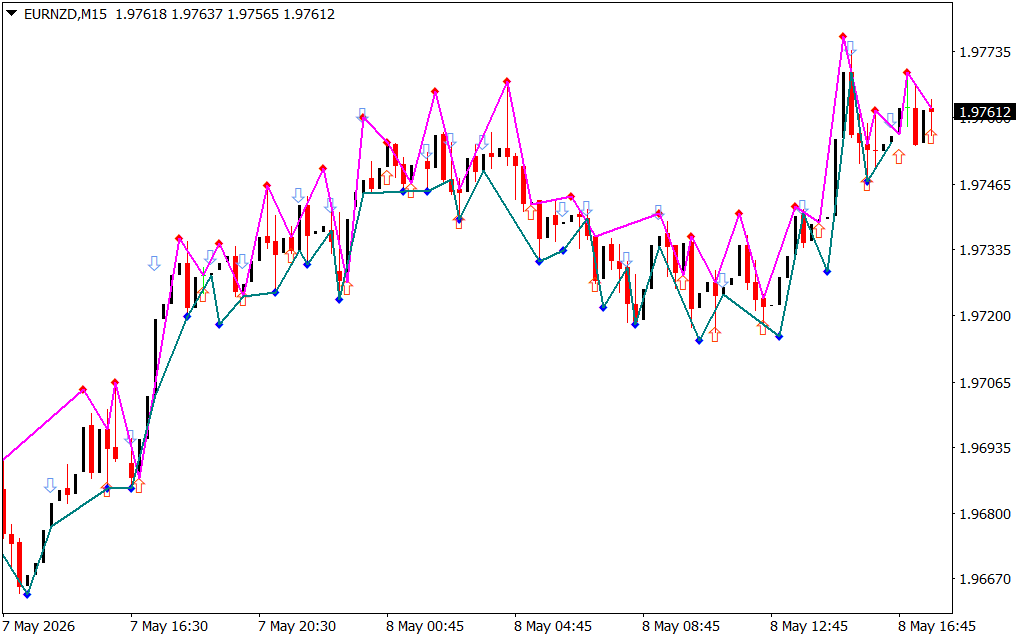
The provided chart features the Fractals Signal Diapazon indicator applied to the EURNZD pair on an M15 timeframe. This advanced technical tool identifies market reversals by mapping fractals and price ranges (diapazons), helping traders visualize key turning points and support/resistance zones in real-time.
Mastering Reversals with the Fractals Signal Diapazon Indicator
In the complex landscape of technical analysis, identifying the exact moment a price trend exhausts itself is the difference between a winning trade and a missed opportunity. While standard fractal indicators often provide lagging or noisy signals, the Fractals Signal Diapazon offers a refined, multi-layered approach. By combining classic Bill Williams fractal logic with automated "diapazon" (range) mapping, this tool provides a clear visual framework for identifying Market Structure shifts.
The Mechanics of Fractals and Ranges
The indicator functions by analyzing local price extremes across multiple candles to establish "fractal" points. However, it goes a step further by connecting these points to create a price range or "diapazon."
- Fractal Geometry: The indicator identifies local highs and lows, marking them with specialized icons to highlight potential reversal zones.
- Trend Visualization: As seen on the EURNZD M15 chart, the indicator uses color-coded lines (magenta for peaks and teal for troughs) to connect these fractal points, creating a clear visual path of the market's current wave structure.
- Signal Precision: Integrated buy and sell arrows (orange for bullish, light blue for bearish) appear when the price breaks through or rejects specific diapazon boundaries, providing objective entry cues.
Strategic Benefits for Professional Traders
- Visualizes Market Structure: The primary advantage of the Fractals Signal Diapazon is its ability to map "Higher Highs" and "Lower Lows" automatically. This helps traders stay aligned with the institutional flow and avoid trading against a strong trend.
- Objective Support & Resistance: The "diapazon" lines act as dynamic horizontal boundaries. When price repeatedly fails to break a magenta fractal line, it confirms a strong resistance zone, allowing for high-confidence short entries.
- Reduced Emotional Bias: By providing definitive arrows and structured lines, the indicator removes the guesswork often associated with manual chart drawing.
- Scalping and Swing Versatility: While highly effective for identifying intraday moves on the M15 timeframe, the algorithm is robust enough to identify major trend cycles on H1 and H4 charts, making it a versatile tool for all trading styles.
How to Trade with Fractals Signal Diapazon
The most effective way to utilize this indicator is the Breakout-Retest method. Traders wait for the indicator to map a clear diapazon (range). A bullish entry is signaled when an orange arrow appears following a break above a recent magenta fractal peak. Conversely, a bearish entry is triggered when a light blue arrow appears as the price falls below a teal fractal trough.
Furthermore, this indicator is a perfect companion for "Smart Money Concepts" (SMC). When a fractal signal aligns with a known Order Block or Liquidity Void, the probability of a successful reversal increases exponentially. By providing a structured, mathematical view of price extremes, the Fractals Signal Diapazon transforms chaotic market noise into a predictable series of tradeable ranges.e.
3 Downloads
Last Update:
May 08, 2026 20:55 PM
Published:
Jan 25, 2026 18:22 PM
Category: