Navigating Market Trends with Precision: A Guide to the FXnav MA Indicator
In the highly volatile world of foreign exchange trading, identifying the core market trend while filtering out short-term market noise is one of the greatest challenges retail traders face. Moving averages are widely considered the foundation of technical analysis, yet traditional moving averages are often plagued by a common flaw: lag. By the time a standard moving average confirms a trend change, a massive portion of the move has already occurred. The FXnav MA Indicator for MT4/MT5 completely redefines trend tracking by combining advanced smoothing algorithms with dynamic multi-color visual alerts, offering scalpers and day traders a real-time roadmap of market momentum.
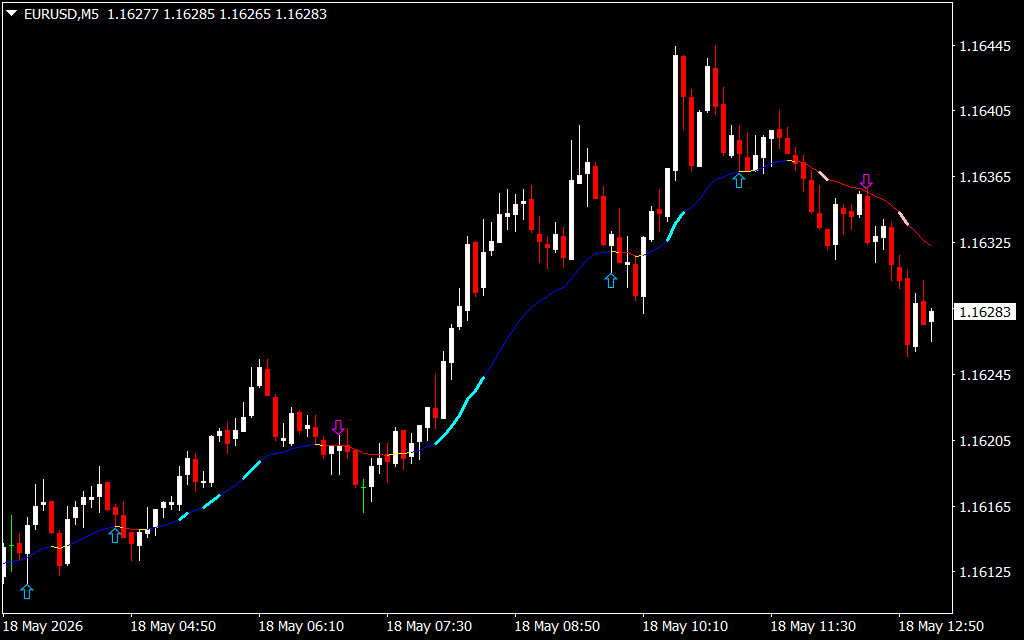
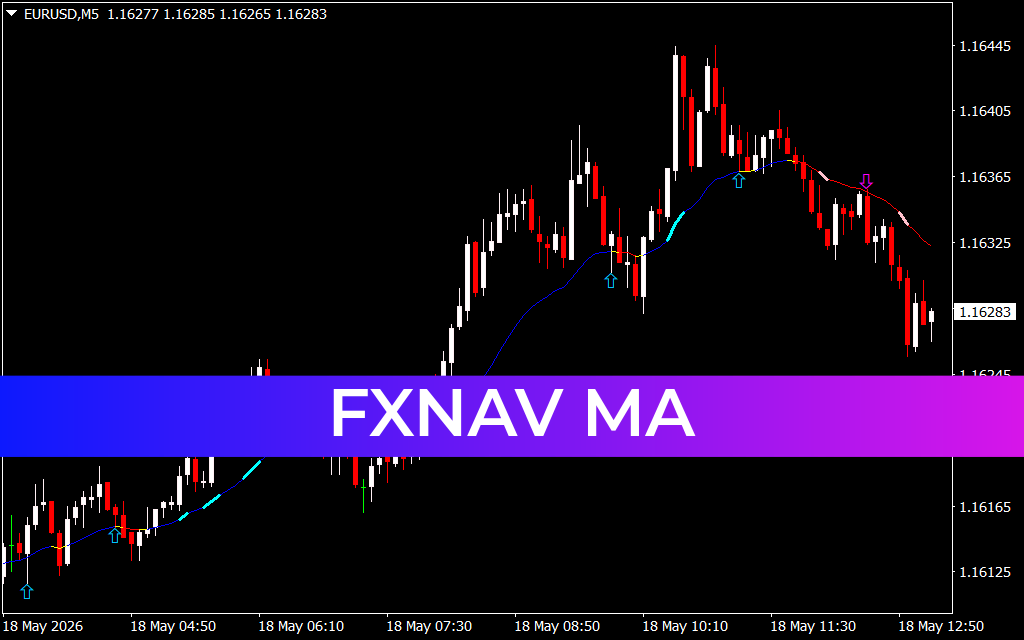
Analyzing Trend Transits on the EUR/USD M5 Chart
The attached EUR/USD 5-minute (M5) chart perfectly illustrates how the FXnav MA indicator simplifies trend navigation during rapidly changing intra-day sessions.
Unlike a static, single-colored line, the FXnav MA dynamically changes its hue based on the underlying strength and velocity of Price Action. During the early morning session on May 18, the asset established an accumulation base near 1.16125. As the buyers seized control, the indicator printed a vivid blue slope, supported by light blue directional arrows pointing upward. This color transition provides immediate visual confirmation that the immediate momentum is strongly bullish.
Notice how the price tracks smoothly above the blue line during the explosive expansion phase past 1.16245 and up toward the swing high near 1.16445. For a high-frequency scalper, this clear, multi-color gradient eliminates guesswork, ensuring you ride the core micro-trend without getting spooked by minor corrective pullbacks.
Identifying Consolidation Phases and Precise Reversals
One of the most powerful features of the FXnav MA indicator is its ability to isolate market consolidation and trend reversals before they catch retail traders off guard. When the market enters a sideways squeeze or distribution phase, the indicator line shifts to neutral yellow and deep red segments.
Looking at the chart around the 06:10 mark, as the initial push stalled, the indicator flattened and turned red, printing a purple downward-pointing arrow near 1.16205. This signal warns traders that the localized buying momentum has exhausted, shifting into a defensive, sideways posture. A similar structural top forms after the major peak at 10:10. The indicator rolls over from blue to red, confirmed by another purple arrow near 1.16365, accurately predicting the ensuing downward cascade toward the current price of 1.16283.
By integrating the FXnav MA indicator into your day trading or Scalping routine, you transform a lagging analytical concept into a responsive, real-time edge. The indicator acts as an automated chart filter, giving you the precision needed to execute flawless entries, manage stop-losses optimally beneath structural pivots, and stay perfectly aligned with institutional order flow.
1 Download
Last Update:
May 18, 2026 16:11 PM
Published:
Jan 20, 2026 14:48 PM
Category: