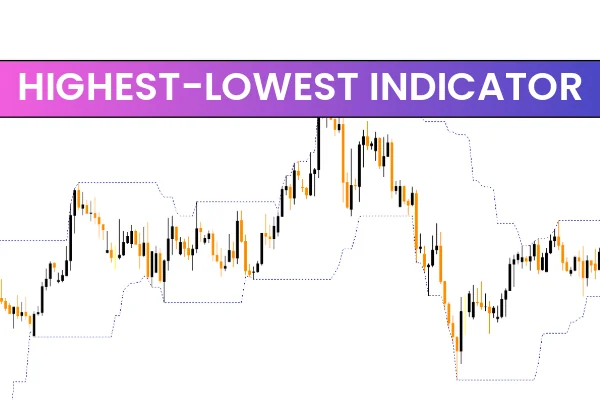
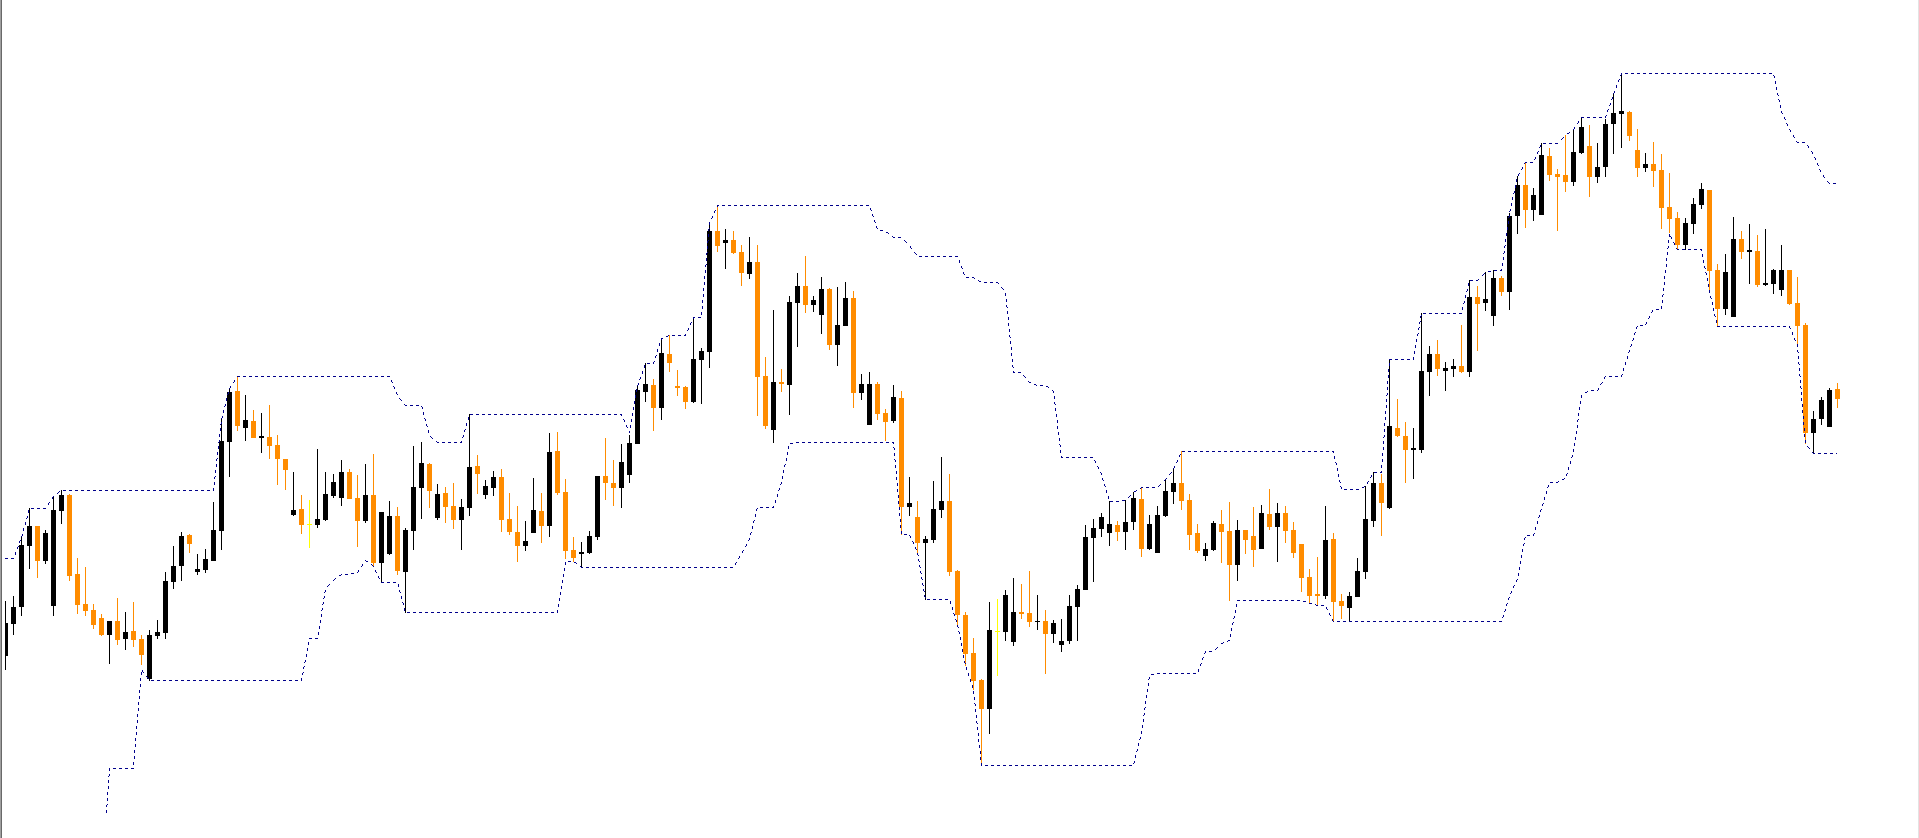
The Highest-Lowest Indicator for MT4 is a must-have tool for forex traders who want to identify critical price levels on their charts. By plotting the highest and lowest prices of the day, week, and month, the indicator allows traders to anticipate price reactions at key Support And Resistance levels.
Although the indicator does not generate explicit buy or sell signals, it provides crucial insight into Market Structure. Traders can use this information to plan entries, exits, and risk management strategies more effectively.
How the Highest-Lowest Indicator Works
The indicator automatically calculates and plots the highest and lowest price levels based on the selected timeframes: daily, weekly, or monthly. These levels act as potential support and resistance zones, guiding traders in evaluating market reversals and trend continuation setups.
Key features include:
Daily, Weekly, Monthly Levels: Quickly identify significant market boundaries.
Visual Alerts on Chart: Highlight potential reversal or breakout zones.
Compatibility: Works seamlessly with MT4, supporting all forex pairs and timeframes.
Traders are encouraged to combine the indicator with Price Action patterns or other technical indicators for confirmation. For example, spotting a bullish engulfing candle at a daily low may suggest a potential upward move, enhancing the probability of a successful trade.
Using the Indicator to Identify Trade Setups
While the Highest-Lowest Indicator does not generate automatic BUY/SELL signals, it provides a framework for manual trade analysis.
Example Trade Setup:
Price approaches yesterday’s low and forms a wick, signaling a rejection of lower prices.
A bullish engulfing candle appears after the rejection, suggesting a potential upward movement.
Traders may consider entering a long position, placing a stop-loss below the wick, and managing risk according to their strategy.
Similarly, when price reacts to a high level, traders can look for bearish reversal patterns or confluences with other indicators like RSI, MACD, or moving averages for short trades.
Benefits of Using the Highest-Lowest Indicator
Anticipate Price Reactions: Key highs and lows act as natural support/resistance.
Multi-Timeframe Analysis: Daily, weekly, and monthly levels help identify strong trend boundaries.
Easy to Use: Beginner-friendly and visually clear on MT4 charts.
Enhances Risk Management: Traders can place stops and targets based on critical price levels.
Free to Download: Available at IndicatorForest.com for immediate use.
Conclusion
The Highest-Lowest Indicator for MT4 is an essential tool for modern forex traders seeking to improve their market timing. By identifying daily, weekly, and monthly highs and lows, it allows traders to anticipate price reactions and make informed trading decisions.
While it does not provide automatic buy or sell signals, the indicator is invaluable for traders who combine it with price action or other technical indicators.
Download the Highest-Lowest Indicator for free at IndicatorForest.com and start identifying key trading levels today!
FAQ
2 Downloads
Published:
Nov 12, 2025 01:12 AM
Category: