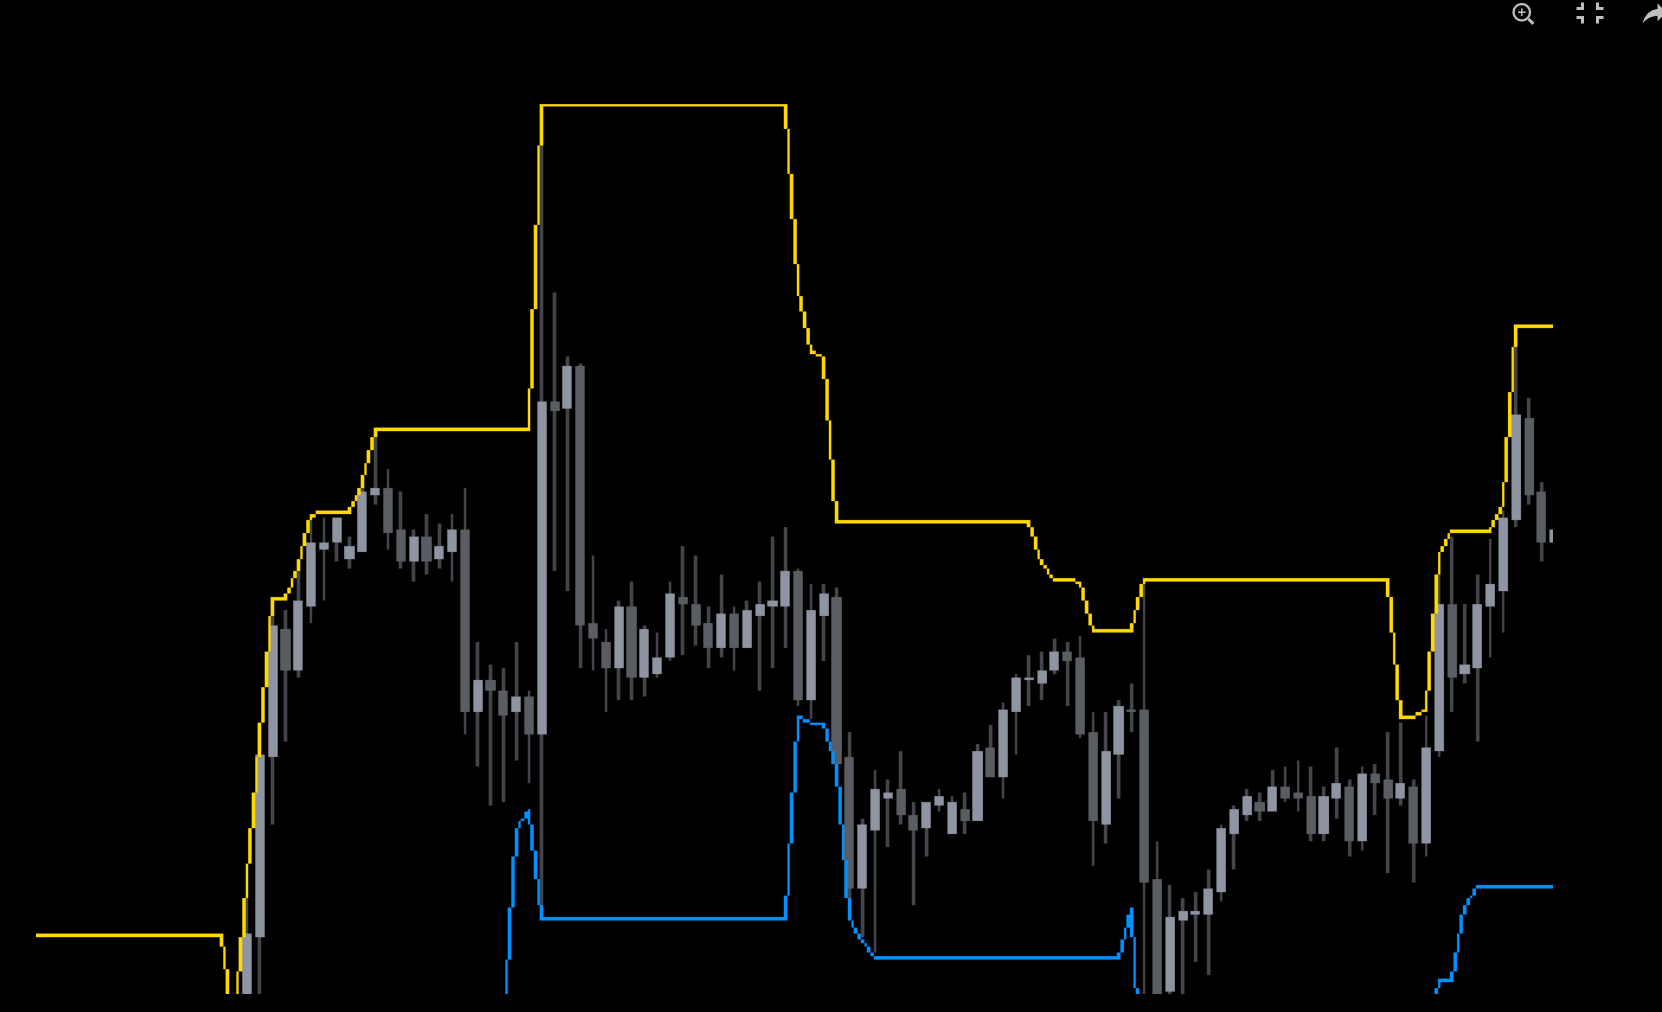
The i-High Low Indicator MT4 is a reliable and easy-to-use Forex Indicator designed to help traders identify critical price levels on the MetaTrader 4 platform. This free indicator automatically displays the highest high and lowest low of a selected timeframe, allowing traders to quickly analyze Market Structure and price behavior. By highlighting these key levels, the indicator assists traders in identifying potential support and resistance zones with greater accuracy.
Because price often reacts around previous highs and lows, this indicator is widely used by both beginner and professional forex traders to improve market timing and decision-making.
What Is the i-High Low Indicator
The i-High Low Indicator is a technical analysis tool that plots the maximum and minimum price levels of a chosen timeframe directly onto the trading chart. Instead of manually searching for these levels, traders can rely on the indicator to calculate and update them automatically.
This saves time, reduces errors, and ensures consistency in technical analysis across different trading sessions and instruments.
How the Indicator Works
The i-High Low Indicator MT4 continuously scans price data and identifies the highest and lowest price points within a defined period.
Core Functions
Automatically plots high and low levels
Updates in real time as price changes
Works on all MT4 symbols
Adjustable timeframe settings
These features make the indicator highly adaptable to different trading strategies.
Identifying Support and Resistance Levels
High and low price levels often act as natural Support And Resistance zones.
High Price Levels
May act as resistance
Indicate potential selling zones
Useful for profit targets
Low Price Levels
Often function as support
Highlight potential buying areas
Assist in stop-loss placement
The i-High Low Indicator MT4 makes these levels clearly visible, helping traders react quickly to market movements.
Using the Indicator for Trend Analysis
Beyond support and resistance, this indicator is also effective for trend identification.
Higher highs and higher lows suggest an uptrend
Lower highs and lower lows indicate a downtrend
Flat highs and lows signal a ranging market
By monitoring how price behaves around these levels, traders gain valuable insight into market direction and momentum.
Trading Strategies with i-High Low Indicator
The indicator can be used in several practical trading approaches.
Breakout Strategy
Enter trades when price breaks above a high or below a low
Confirm with volume or momentum indicators
Use previous levels as targets
Reversal Strategy
Look for rejection at high or low levels
Combine with candlestick patterns
Confirm using oscillators or trend indicators
Using confirmation tools helps reduce false signals and improves trade reliability.
Customization and Timeframe Settings
The i-High Low Indicator MT4 allows traders to customize:
Timeframe selection
Line colors and styles
Visibility settings
This flexibility ensures compatibility with Scalping, intraday, and swing trading strategies.
Advantages of i-High Low Indicator MT4
Free to download and use
Automatically identifies key price levels
Improves chart clarity
Works across all markets and timeframes
Suitable for beginners and experienced traders
Its simplicity and effectiveness make it a valuable addition to any MT4 trading setup.
Conclusion
The i-High Low Indicator MT4 is an essential technical tool for traders who want to clearly identify important price levels and improve market analysis. By automatically plotting high and low points, it simplifies support and resistance identification and enhances trend analysis.
👉 Visit IndicatorForest.com to explore more free MT4 indicators, advanced trading tools, and expert forex guides to strengthen your trading strategies.
FAQ
I High LOW automatically identifies and marks the highest high and lowest low points on your chart. It helps traders spot key support/resistance levels, swing points, and potential reversal zones.
The indicator scans price action to identify local maximums (highs) and minimums (lows) within a specified period. It filters out minor fluctuations and marks only significant price extremes that may act as support or resistance.
Use identified highs as resistance levels and lows as support, enter trades when price approaches these levels, trade breakouts when price moves beyond highs or lows, and use them for stop-loss and take-profit placement.
Automatic detection saves time compared to manual marking, provides objective level identification, reduces human error, and ensures consistent identification of key price levels across different charts.
Combine with trend indicators to trade in the right direction, use with momentum oscillators for confirmation, integrate with candlestick patterns for entry timing, and combine with volume analysis to validate level strength.
1 Download
Published:
Dec 17, 2025 10:38 AM
Category: