Decoding Equilibrium: Mastering Market Structure with the Ichimoku Chart Darks Indicator
The foreign exchange market moves in complex waves, often making it difficult for day traders to separate genuine trend continuations from deceptive market noise. While many retail traders rely on a combination of disjointed indicators to determine trend, support, and momentum, professional technical analysts favor an all-in-one equilibrium model. The Ichimoku Chart Darks Indicator for MT4/MT5 adapts the time-tested Japanese Ichimoku Kinko Hyo system specifically for dark-themed chart templates, delivering a high-contrast layout that reveals the market's true structural narrative at a single glance.
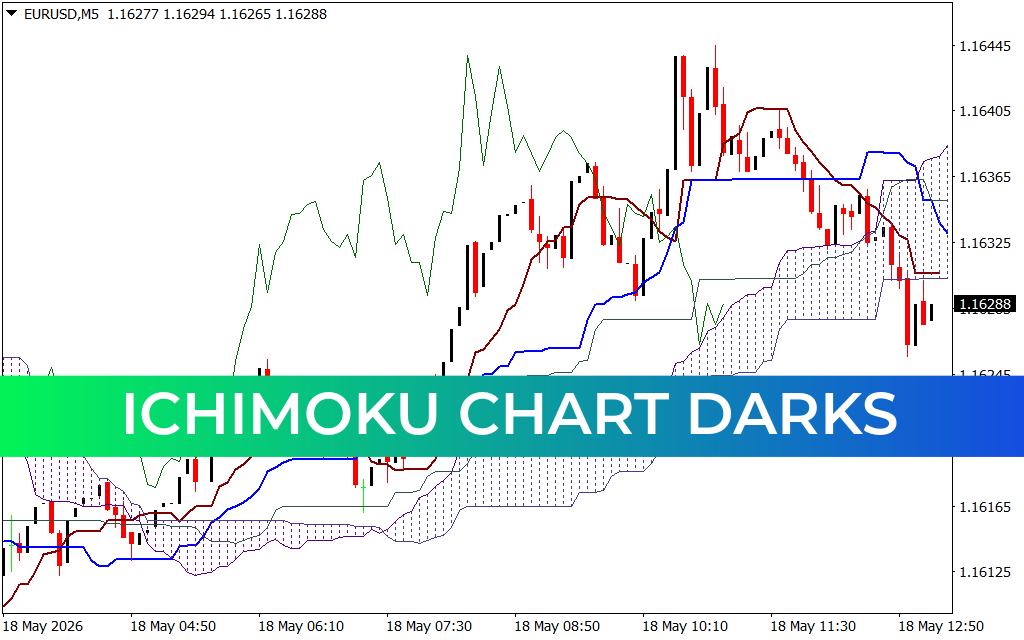
The Five Pillars of Equilibrium on EUR/USD M5
The provided EUR/USD 5-minute (M5) chart showcases the profound analytical clarity this indicator offers during an active, multi-phase trading session. Rather than viewing Price Action in isolation, the Ichimoku Chart Darks system maps five specific lines to project past, present, and future market sentiment.
Early in the May 18 session, the pair established an accumulation floor around 1.16125. As the bullish momentum initiated, the fast-moving Tenkan-sen (conversion line, shown in dark red) crossed decisively above the slower Kijun-sen (base line, shown in vivid blue). This crossover acts as a powerful trigger for momentum scalpers.
As the price aggressively expanded past the 1.16245 level, it moved well above the Kumo (the cloud, filled with a distinct purple and white dotted matrix). In Ichimoku theory, the cloud represents the ultimate boundary of structural Support And Resistance. When price trading clears the cloud to the upside, it signals an uninhibited bullish market environment where buyers maintain absolute control. Notice how smoothly the blue Kijun-sen acted as a trailing dynamic floor during the steep ascent toward the 1.16445 swing high, keeping traders securely positioned in the core macro-move.
Predicting Shifts and Future Support Zones
One of the most extraordinary components of the Ichimoku Chart Darks indicator is its predictive capability, dictated by the forward-projected Senkou Span boundaries. While standard moving averages are strictly reactive, the Kumo cloud shifts shapes and coordinates 26 periods ahead of the current price action.
Following the mid-day peak near 10:10, the EUR/USD pair began printing large bearish candlesticks, plunging backward through the red conversion line to test the 1.16288 level. For a day trader, this sudden collapse can induce panic. However, looking ahead on the chart, the indicator projects a thickening, supportive cloud matrix. This forward structure warns traders that while short-term momentum has rotated down, a massive zone of institutional buying liquidity resides just below the current price.
By utilizing the Ichimoku Chart Darks indicator in your daily operations, you eliminate the fragmentation of using multiple tools. It streamlines trend identification, highlights precise entry crossovers, provides dynamic stop-loss levels, and visualizes future support or resistance zones, giving you an institutional-grade edge on every trade.
1 Download
Last Update:
May 18, 2026 16:13 PM
Published:
Jan 20, 2026 14:45 PM
Category: