Capture Explosive Breakouts with the Squeeze RA V1 Indicator
In the financial markets, price transitions between two distinct phases: low-volatility consolidation and high-volatility expansion. Most retail traders lose capital by trying to force trend-following strategies during sideways markets, falling victim to choppy ranges. If you want to capitalize on major market expansions on intraday intervals like the 30-minute (M30) chart, you need a tool that detects when a market is priming for a major move. The Squeeze RA V1 indicator is a premier technical oscillator engineered to pinpoint the exact transition from market compression to explosive breakout.
What is the Squeeze RA V1 Indicator?
The Squeeze RA V1 indicator is an advanced technical system built for modern trading platforms like MetaTrader. It is heavily inspired by the core mechanics of John Carter’s legendary TTM Squeeze volatility model, which identifies the relationship between Bollinger Bands and Keltner Channels.
When the market enters a tight consolidation phase, the Bollinger Bands contract completely inside the Keltner Channels, signaling a "squeeze." This indicates that market energy is building up like a compressed spring. Once Price Action expands and the Bollinger Bands break outside the Keltner Channels, the squeeze fires, launching a powerful trend expansion. The V1 edition optimizes this calculation with a clean dual-color momentum histogram and a central volatility tracking baseline.
Key Visual Features and Trading Insights
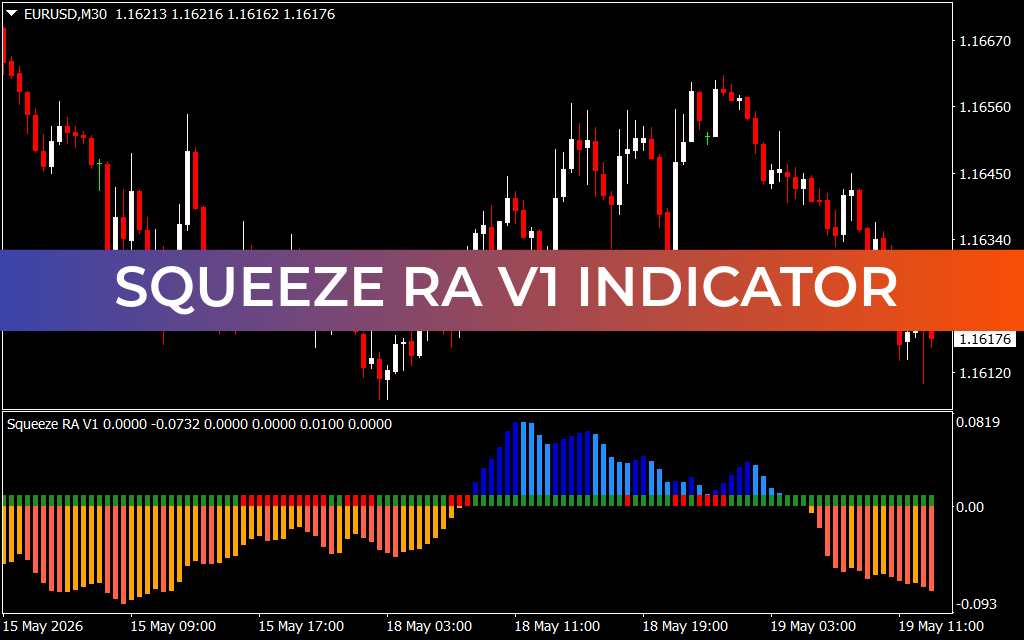
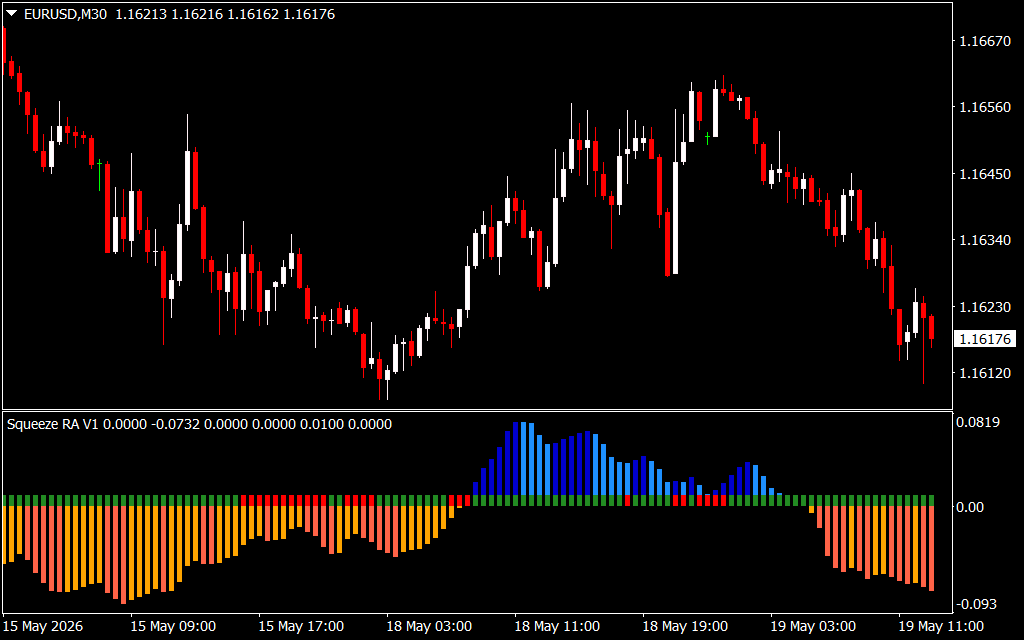
- The Volatility Baseline: The core of the indicator features a horizontal zero-line embedded with small colored squares (green and red). Red squares reveal a tight market squeeze (low volatility), while green squares indicate that the squeeze has released and a breakout is actively occurring.
- Dual-Color Momentum Histogram: The vertical bars measure underlying direction and momentum velocity.
- Bullish Momentum: Light blue and dark blue histogram bars rising above the 0.00 baseline represent expanding buying pressure.
- Bearish Momentum: Red and orange histogram bars expanding below the 0.00 baseline reveal an aggressive downward impulse.
- Clean Sub-Window Layout: As seen on liquid assets like the EUR/USD M30 chart, the indicator keeps your primary price workspace completely clutter-free, allowing you to combine raw candlestick formations with underlying volatility cycles.
How to Trade with Squeeze RA V1
Trading with the Squeeze RA V1 indicator involves waiting for low-volatility periods to conclude and entering right as institutional volume enters the market.
- Spotting a Short Entry: Watch the indicator zero-line until a string of red dots appears, proving that a squeeze is underway. Once the zero-line dots turn green and a powerful orange or red histogram bar extends below the 0.00 threshold, a bearish breakout is verified. Enter a short position to capture the accelerating decline.
- Spotting a Long Entry: Conversely, when a tight squeeze releases and the histogram prints expanding blue bars above the center line, a bullish breakout is active. Enter a long trade to ride the upward wave.
Equip your charting setup with the Squeeze RA V1 indicator today to accurately time volatility cycles and master the art of breakout trading.
24 Downloads
Last Update:
May 19, 2026 16:30 PM
Published:
Jan 19, 2026 13:35 PM
Category: