their trading strMaster the Market with the IMA True Fibs Below Indicator
In the fast-paced world of Forex and stock trading, technical indicators are the compass by which traders navigate volatile Price Action. Among the most respected tools in a professional’s arsenal are Fibonacci retracements and extensions. However, manually drawing these levels can be subjective and time-consuming. The IMA True Fibs Below Indicator is designed to solve this problem by automating the identification of critical support levels, helping traders find high-probability entry points with precision.
What is the IMA True Fibs Below Indicator?
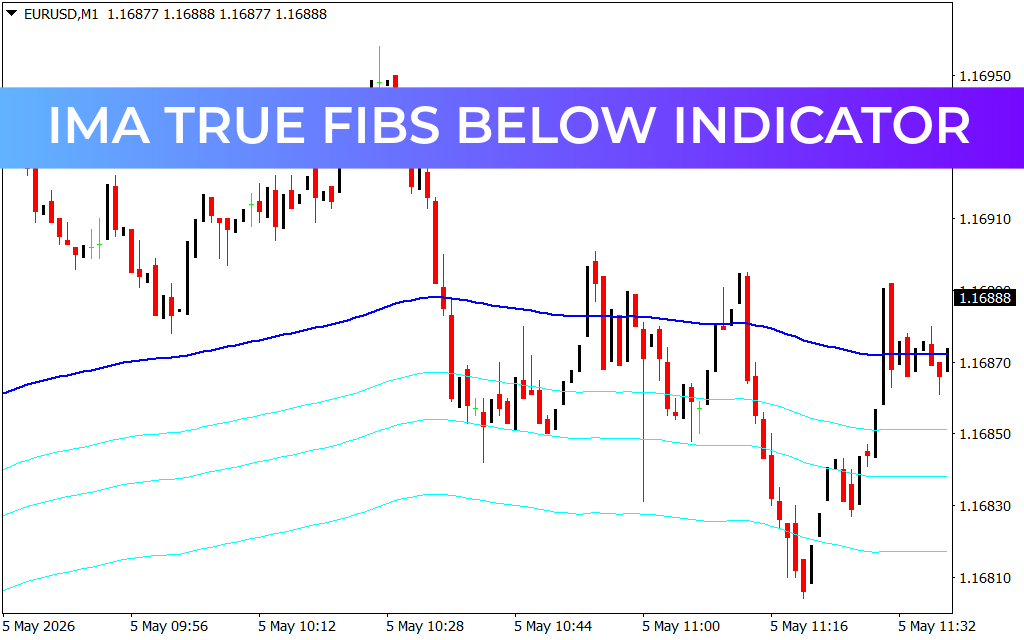
The IMA True Fibs Below Indicator is a technical analysis tool specifically programmed for trading platforms like MT4 and MT5. Unlike standard Fibonacci tools that require a user to select a "swing high" and "swing low," this indicator uses a sophisticated algorithm to identify real-time price structures. It focuses specifically on levels below the current market price, acting as a predictive map for where a retracement might end and where a bullish bounce is likely to occur.
Key Features and Benefits
- Automated Level Generation: Eliminate the guesswork. The indicator automatically plots key Fibonacci ratios such as 38.2%, 50%, and 61.8% based on the most relevant recent price data.
- Dynamic Support Identification: By highlighting "Fibs Below," the tool provides immediate visual cues for stop-loss placement and buy-limit orders.
- Trend Confirmation: It works seamlessly with moving averages and trendlines. When a price retraces to an "IMA True Fib" level that coincides with a major moving average, the probability of a successful trade increases significantly.
- Clutter-Free Interface: Designed for clarity, it keeps your charts clean, showing only the most vital levels relevant to the current price action.
Why Focus on "Fibs Below"?
Psychologically, many traders struggle with "chasing the market." They see a price move up and feel the need to jump in immediately, often buying at the peak. The IMA True Fibs Below Indicator encourages a more disciplined approach: buying the dip. By visualizing exactly where the "True Fibs" sit below the current price, traders can patiently wait for the market to come to them, ensuring a much better risk-to-reward ratio.
How to Trade with the Indicator
Using the IMA True Fibs Below is straightforward even for beginners. When the market is in an uptrend, look for price to pull back toward the indicated cyan lines.
- Entry: Look for bullish reversal candles (like hammers or engulfing patterns) when the price touches a True Fib level.
- Stop Loss: Place your stop just below the next Fibonacci level down to protect your capital.
- Take Profit: Aim for the previous swing high or use Fibonacci extension levels for larger targets.
Conclusion
The IMA True Fibs Below Indicator is more than just a drawing tool; it is a strategic advantage. By automating the most reliable support levels in the market, it allows you to trade with confidence and consistency. Whether you are Scalping the M1 timeframe or swing trading the Daily charts, this indicator is an essential addition to your trading toolkit.ategy.
1 Download
Last Update:
May 05, 2026 16:02 PM
Published:
Jan 27, 2026 20:01 PM
Category: