Striking Gold in Forex: Riding Trend Expansions with the JJN Nugget Indicator
For retail day traders and high-frequency scalpers, the primary hurdle to consistent profitability is timing an entry at the exact genesis of a structural market expansion. Entering a position too early frequently exposes an account to severe drawdown inside a deceptive consolidation squeeze, while entering too late means chasing Price Action right as institutional liquidity prepares to reverse. The JJN Nugget Indicator for MT4/MT5 bridges this technical gap. By overlaying an advanced multi-color algorithmic line directly onto your price candlesticks, this dynamic charting tool simplifies trend tracking and helps traders execute high-probability entries with complete rules-based objectivity.
Mapping Market Geometry on the EUR/USD M5 Chart
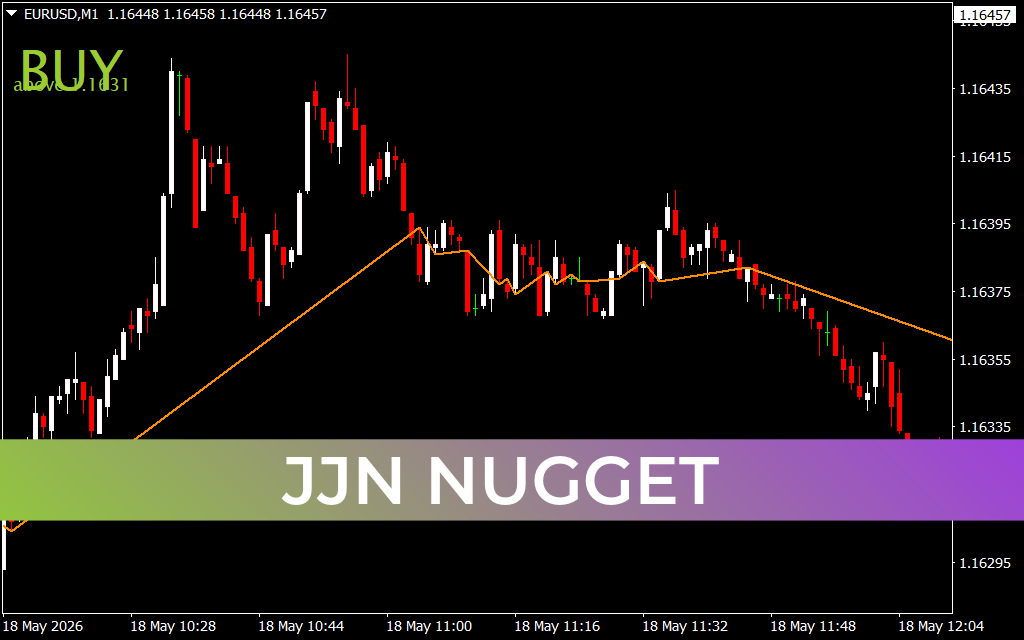
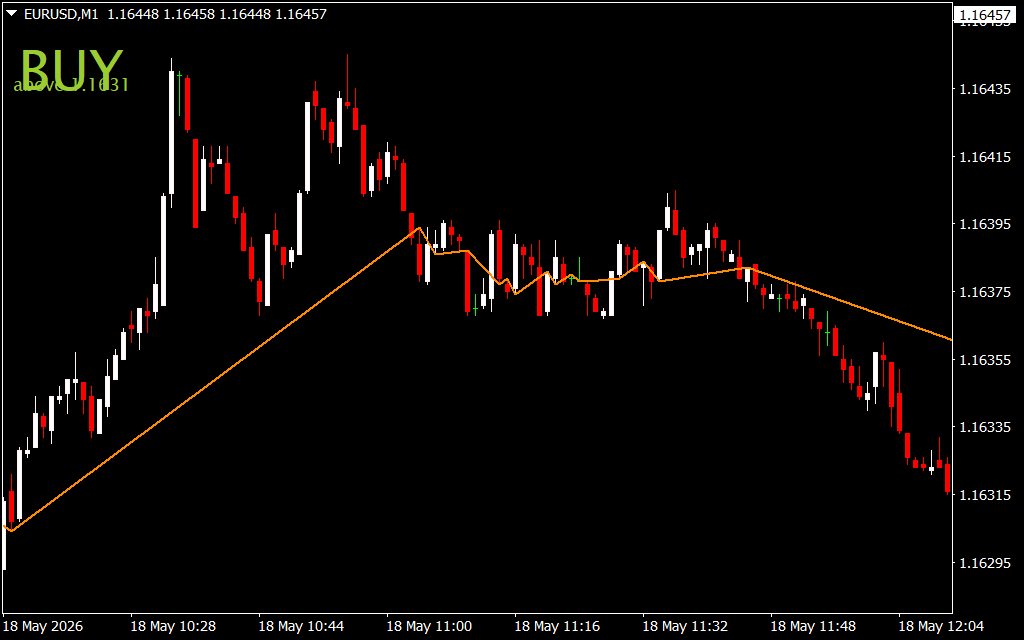
The provided EUR/USD 5-minute (M5) chart illustrates the profound technical clarity the JJN Nugget indicator introduces to intraday workspaces. Operating as a smoothed, adaptive moving average vector, the indicator cuts through chaotic pricing variance by shifting between distinct structural colors—deep blue, cyan, yellow, orange, and red—paired with real-time on-chart execution arrows.
During the early morning session of May 18, the currency pair established a localized accumulation floor near the 1.16125 liquidity pocket. In standard charting setups, minor retail pullbacks trigger highly erratic signal changes.
Notice how the JJN Nugget engine beautifully streamlines this initial markup phase: as buyers stepped into the market, the indicator line flipped to a solid cyan posture, printing a clear blue upward arrow at 1.16135. For trend-followingday traders, this dual visual confirmation signals that institutional order flow is firmly bullish. It provides the conviction to ride the wave as the asset steadily expanded upward through consecutive technical thresholds.
Navigating Trend Transitions and Volatility Climaxes
The true strategic power of the JJN Nugget indicator unfolds when a fast-moving trend leg reaches volatility exhaustion and transitions into a distribution phase. Following a vertical, V-shaped expansion that drove the price aggressively up toward a macro session peak at 1.16445, the buying velocity began to stall.
As institutional algorithms began extracting profits, the price action initiated a structural rollover. The JJN Nugget indicator reacted instantly to this shift in underlying volume distribution: the line rotated from a bullish blue setting into a yellow caution state, followed immediately by an orange and deep red structural markdown line.
Right at the pivot zone near 1.16365, the indicator printed a sharp pink downward arrow. This timely on-chart alert warns day traders that the bullish macro leg has completely evaporated, allowing shorts to capture a rapid, multi-pip descent down toward the 1.16283 liquidity pool.
Currently tracking the immediate descent cleanly, the tool serves as a dynamic trailing stop barrier. By upgrading your trading platform with the JJN Nugget indicator, you remove human emotion from your daily risk management, accurately distinguish between minor pullbacks and major structural reversals, and manage your trade entries with absolute precision.
25 Downloads
Last Update:
May 18, 2026 17:09 PM
Published:
Jan 19, 2026 21:27 PM
Category: