The Jurik Volty Bands Separate Indicator for MT4 is a momentum-based trading tool designed for day traders looking for precise buy/sell signals. Unlike traditional trend or OB/OS indicators that rely on fixed parameters, this indicator uses dynamic volatility bands, adjusting automatically to market price changes.
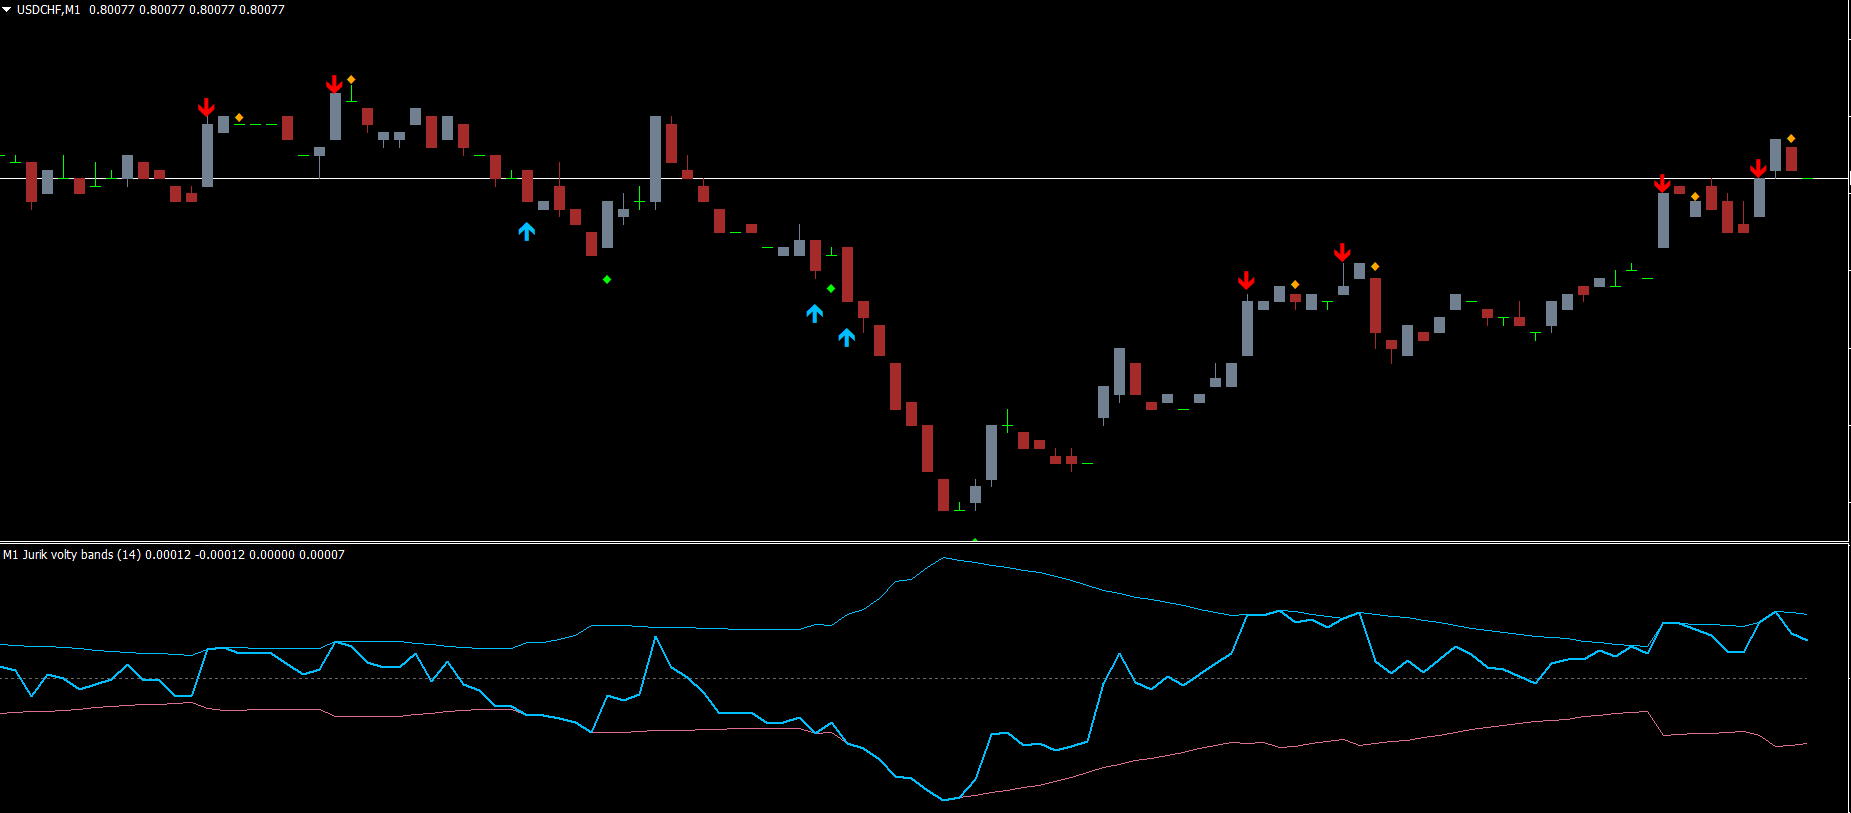
It plots buy/sell arrows, Trend Reversal dots, and a momentum oscillator directly on the main chart, making it easy to interpret potential entry and exit points.
This tool works across all MetaTrader 4 timeframes, but hourly and higher timeframes are recommended for more consistent and reliable signals.
At IndicatorForest.com, you can download the Jurik Volty Bands Separate Indicator for free and start identifying high-probability trading setups in forex and stock markets.
How the Jurik Volty Bands Separate Indicator Works
The indicator operates using dynamic volatility bands rather than fixed OB/OS levels:
Overbought signals: When the indicator line hits the upper band, suggesting a potential price pullback or trend reversal.
Oversold signals: When the line reaches the lower band, indicating a possible bullish reversal.
The indicator combines arrow and dot signals for stronger confirmations:
Arrow Signal: Appears when the indicator line touches the upper or lower band, representing the primary trend direction.
Dot signal: Confirms trend reversal if the indicator hits the overbought/oversold zone twice.
Traders should combine arrow and dot signals with Price Action, support/resistance levels, or other indicators for higher accuracy.
Trading Strategy Using Jurik Volty Bands Separate
1. Trend-Following Entries:
Buy Setup: Blue arrow + green dot below candle + price rejecting support zone.
Sell Setup: Red arrow + red dot above candle + price rejecting resistance zone.
2. Support/Resistance Confirmation:
Use horizontal Support And Resistance or moving averages to identify additional trend confirmation.
3. Multi-Timeframe Analysis (MTF):
Analyze higher timeframe trends for trend-following setups.
Combine smaller timeframe signals for better Scalping opportunities.
4. Scalping Opportunities:
In range-bound markets, the Jurik Volty Bands Separate indicator can be used to scalp highs and lows effectively, making it versatile for intraday trading.
By combining indicator signals with market context, traders can find high-probability setups and increase trading accuracy.
Advantages of the Jurik Volty Bands Separate Indicator
Dynamic OB/OS levels adjust automatically to price changes.
Visual buy/sell arrows and dot trend reversals make trading decisions simple.
Works on all MT4 timeframes; ideal for scalping and trend-following strategies.
Beginner-friendly interface; no complex setups required.
Can be combined with support/resistance, moving averages, or momentum indicators for stronger confirmation.
Considerations:
Works best on hourly and higher timeframes for consistent results.
Always confirm signals with price action or additional trend indicators.
Conclusion
The Jurik Volty Bands Separate Indicator for MT4 is a powerful yet beginner-friendly tool for spotting trend-following buy/sell signals in forex and stock markets. By combining arrow and dot signals with horizontal support/resistance and price action, traders can identify high-probability trade setups.
Whether you are scalping in range markets or trading higher timeframe trends, this indicator gives you a clear visual edge and improves decision-making.
You can download the Jurik Volty Bands Separate Indicator for MT4 for free at IndicatorForest.com and start enhancing your trading strategy today.
FAQ
19 Downloads
Published:
Nov 11, 2025 23:21 PM
Category: