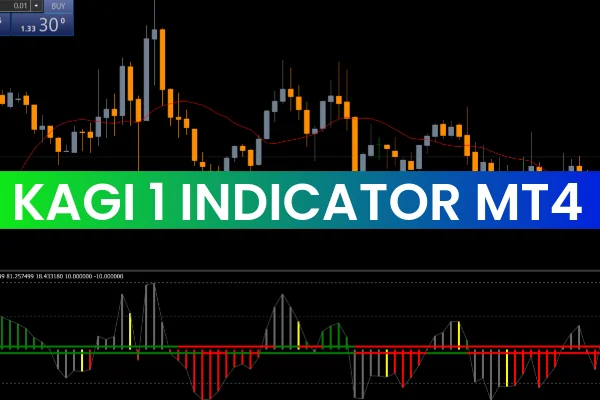
The KAGI 1 Indicator for MT4 is a powerful trend and momentum tool designed to help traders identify precise entry and exit points in the Forex, stock, and commodities markets. This indicator reacts quickly to market changes and places a strong focus on recent price movement, making it valuable for Scalping, day trading, and swing trading.
Momentum trading relies on the idea that if a price moves with strong force, it will likely continue in that direction. The KAGI 1 Indicator helps traders track momentum shifts and determine whether buyers or sellers currently control the market. Because it adjusts dynamically to changing conditions, the indicator can provide earlier alerts of potential trend reversals.
How the KAGI 1 Indicator Works
The KAGI 1 Indicator changes color and thickness based on market sentiment:
Thick Blue Line → Bullish Trend
Light Blue Line → Bearish Trend
Unlike conventional oscillators, the KAGI 1 responds directly to price movement rather than time. This allows it to filter out noise and highlight only meaningful directional changes in the market.
A unique feature of this indicator is that its slope moves opposite the direction of the trend:
During a bullish trend, the slope value drops.
During a bearish trend, the slope value rises.
This inverse behavior helps traders confirm Trend Strength and spot fatigue early.
Using the KAGI 1 Indicator for Buy and Sell Signals
The key to trading successfully with this tool is recognizing when the indicator transitions between thin and thick line states and when the color changes.
Buy Signal Conditions
A strong buy opportunity may be present when the following occur:
The KAGI line shifts from thin/light blue to thick blue
Price rejects a support level or trendline
Candlestick structure confirms bullish continuation
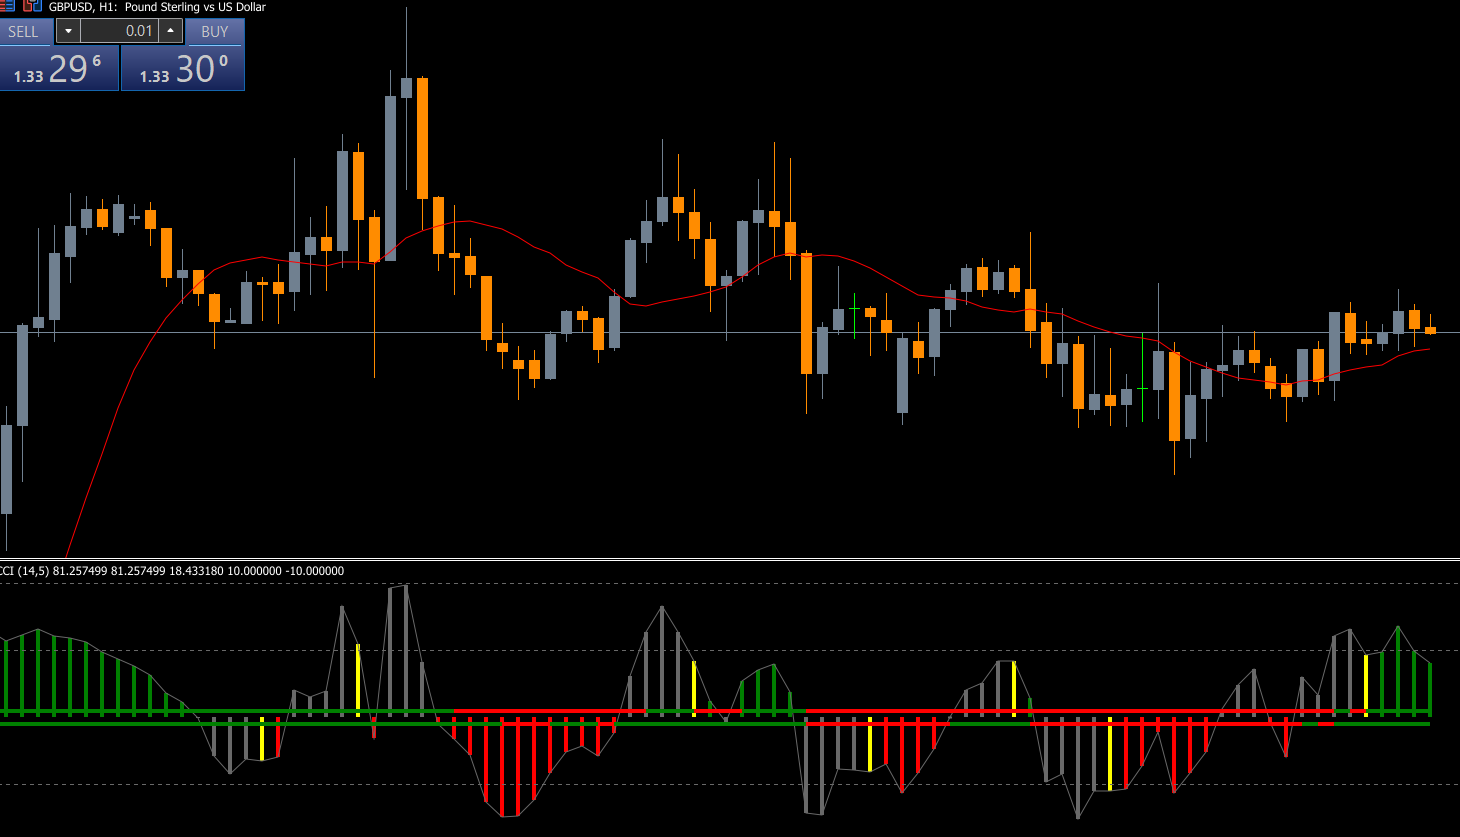
For example, in a GBP/USD H4 setup, price extended upward after testing a support trendline. As soon as the KAGI changed to thick blue, it confirmed bullish momentum — signaling a potential long entry.
Sell Signal Conditions
A valid sell setup may form when:
The line turns light blue, indicating bearish dominance
A bearish candlestick pattern appears near resistance
Market Structure confirms lower highs or breakdowns
Waiting for both Price Action and indicator confirmation can significantly reduce false entries.
Best Timeframes and Markets
Although the KAGI 1 Indicator works on all timeframes, traders typically achieve the best reliability on:
M30
H1
H4
It is suitable for:
Forex pairs
Indices
Crypto
Stocks and commodities
Since it is MTF-enabled, traders can monitor long-term trends while executing short-term entries.
Why Traders Use the KAGI 1 Indicator
Simple visual interface
Effective trend confirmation
Works well with support/resistance and price action
Helps detect early market reversals
Useful for both beginners and experienced traders
For enhanced accuracy, traders may combine it with tools like Moving Averages, RSI divergence, or Volume Profile.
Conclusion
The KAGI 1 Indicator for MT4 is an efficient and beginner-friendly tool for identifying trend reversals, momentum shifts, and high-probability trade setups. By watching color changes and slope behavior, traders can capture early signals and maximize potential profit in Forex, stock, and crypto markets.
👉 Download the KAGI 1 Indicator for MT4 today at IndicatorForest.com and explore more premium trading tools and strategies.
FAQ
3 Downloads
Published:
Dec 09, 2025 03:19 AM
Category: