trade with Algorithmic Precision Using the Kamarev Indicator
Navigating the foreign exchange market requires a balance between trend tracking and timing. Standard moving averages frequently lag during fast breakout expansions, while traditional oscillators give premature signals during choppy distributions. The Kamarev Indicator for MetaTrader is engineered to solve these classic technical dilemmas. By implementing a highly responsive mathematical algorithm, this custom oscillator adapts to changing market volatility, helping retail traders isolate major institutional moves from minor intraday price noise.
Understanding the Mechanics of the Kamarev Sub-Window
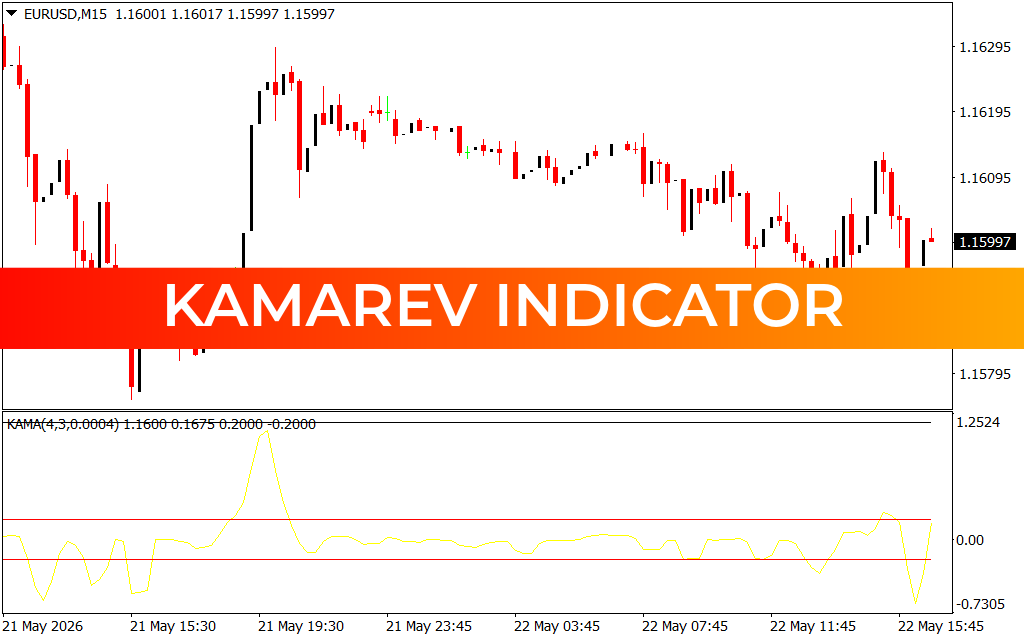
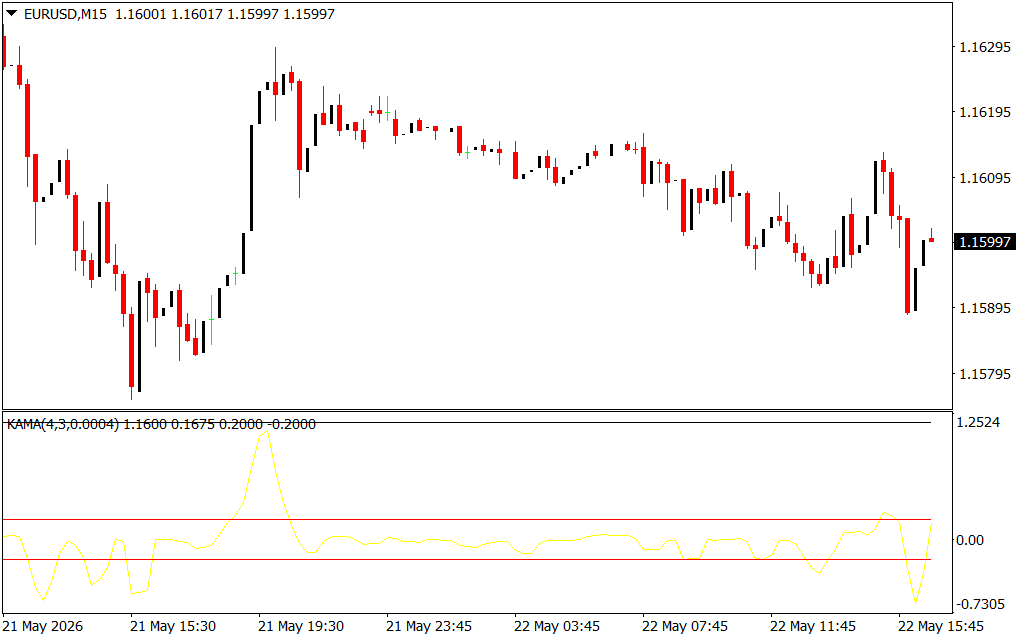
The Kamarev Indicator functions as a dynamic momentum oscillator, isolating market velocity and volume analysis from the main candlestick panel. This allows you to keep your primary price charts completely clean and uncluttered. As displayed on the EURUSD M15 chart, the tool utilizes an adaptive Kaufman Efficiency Ratio or similar adaptive smoothing model—labeled as KAMA in the parameters—to measure structural shifts.
The indicator is composed of three critical visual components:
- The Yellow Signal Line: This dynamic oscillator line plots the mathematical velocity of the asset. It moves fluidly based on real-time price changes, accelerating during aggressive trends and flattening out during consolidation phases.
- The Upper and Lower Red Boundaries: These horizontal channels act as fixed threshold zones. They define the boundaries between normal market distribution and explosive institutional momentum.
- The Zero Centerline: Serves as the equilibrium point for the asset, marking the transition from a bullish market environment to a bearish one.
Key Trading Features and Strategic Advantages
- Adaptive Volatility Smoothing: The underlying algorithm actively scales its sensitivity. It tightens during explosive, low-lag breakouts and smooths out during slow, directionless ranges.
- Objective Breakout Detection: When the yellow signal line pierces through the upper or lower red threshold lines, it confirms a definitive breakout rather than a temporary retracement.
- Clean Visual Hierarchy: The bottom-pane configuration ensures your Price Action analysis remains free from messy overlays, allowing you to easily spot candlestick patterns.
- Optimized for Intraday Trading: Performing exceptionally well on the 15-minute chart, it serves as an excellent timing tool for scalpers and day traders alike.
How to Trade Successfully with the Kamarev Indicator
To maximize your win rates, integrate the Kamarev Indicator into a disciplined execution model:
- Bullish Momentum Identification: Look for scenarios where the yellow signal line surges above the upper red boundary, as demonstrated by the prominent peak on the chart near the 21 May 19:30 session. This confirms institutional buying power, signaling a strong long position opportunity.
- Bearish Momentum Identification: Conversely, when the yellow line breaks sharply below the lower red boundary line, a significant influx of short volume is verified, clearing the way for selling entries.
- Exit and Reversion Control: When the yellow line stretches to extreme outer limits (such as the -0.7305 or 1.2524 levels shown on the scale) and begins curving back toward the zero centerline, the current trend is exhausted. Traders use this cue to take profits or tighten trailing stop-losses.
1 Download
Last Update:
May 22, 2026 19:48 PM
Published:
Jan 17, 2026 18:38 PM
Category: