Master Volatility and Trend Riding: Ultimate Guide to the KC Channel Indicator
Identifying the exact boundary where an asset transitions from standard market noise into an aggressive breakout is key to profitable trading. While standard band indicators like Bollinger Bands expand rapidly during high volatility, they can occasionally become erratic due to their reliance on standard deviation.
For a smoother, more reliable look at true Market Structure, professional traders turn to the KC Channel (Keltner Channel) indicator. By combining a core exponential moving average with an Average True Range (ATR) calculation, this tool provides an adaptive envelope that perfectly maps trend direction and market volatility.
What is the KC Channel Indicator?
The KC Channel is a classic, volatility-based technical indicator that draws an outer envelope around an asset's Price Action. The structure relies on three distinct layers:
- The Center Line: An Exponential Moving Average (EMA) that acts as the baseline trend direction.
- The Upper & Lower Bands: Volatility lines projected above and below the baseline using a multiplier of the Average True Range (ATR).
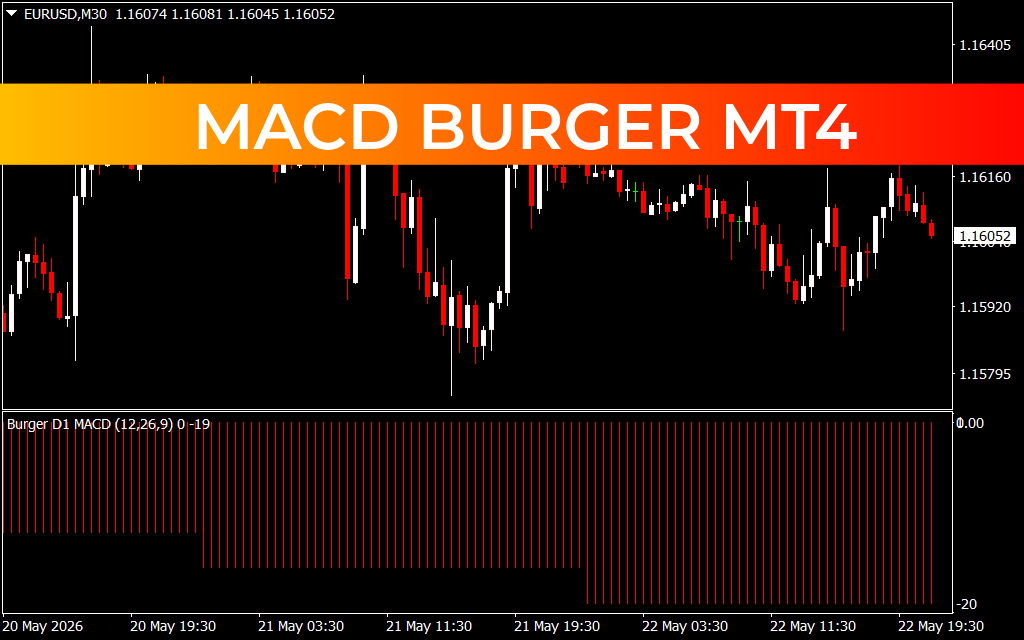
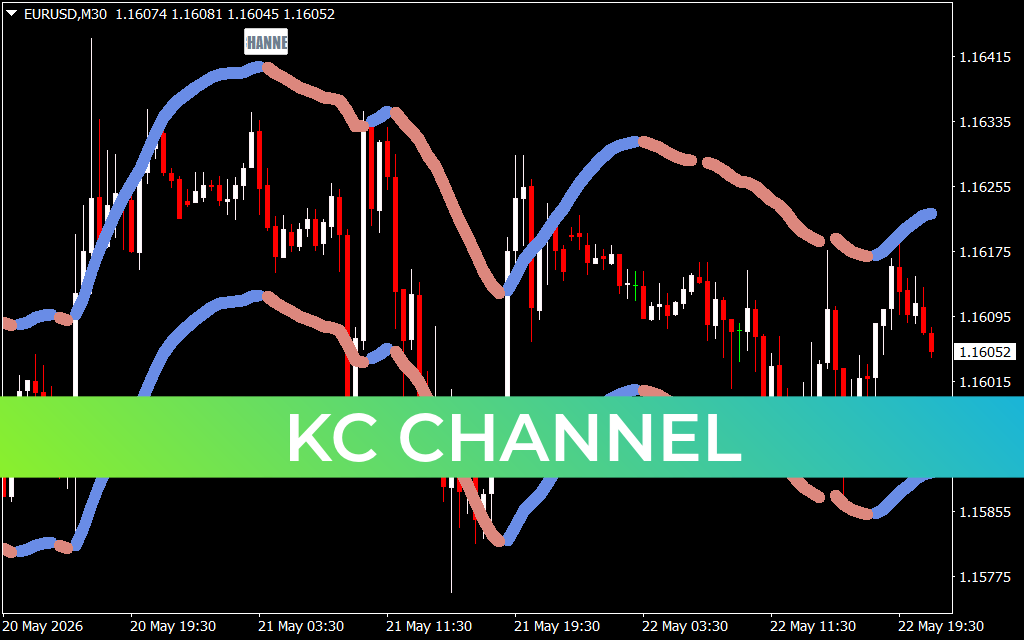
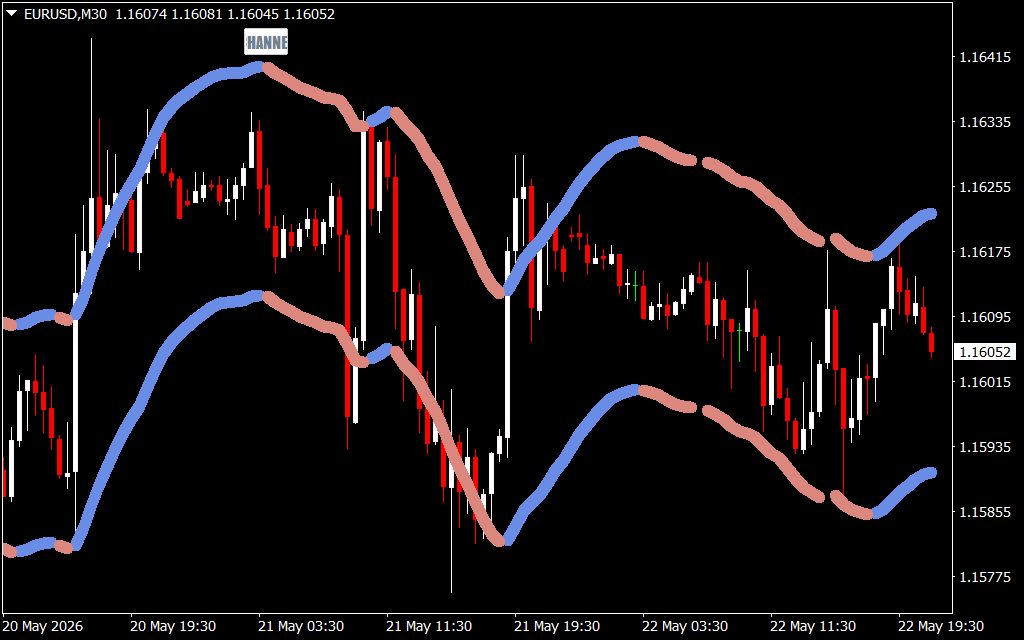
As highlighted in the EUR/USD 30-minute (M30) chart above, this premium version featuring custom color mapping seamlessly changes shades to reflect immediate structural changes. The bands shift from an upward-sloping blue envelope (indicating dominant bullish momentum) to a downward-sloping coral/pink envelope (highlighting bearish control).
Key Features and Strategic Advantages
- ATR-Driven Volatility Adjustments: Because it measures the true average range of price movement, the channel expands and contracts without being skewed by sudden, single-candle price spikes.
- Visual Trend Mapping: The real-time color shifts (blue for uptrends, coral for downtrends) let you gauge market bias across multiple assets in a fraction of a second.
- Clear Overbought/Oversold Limits: Price staying outside the bands alerts you to unsustainable momentum, making it easier to lock in profits or look for corrective positions.
- Multi-Timeframe Scalability: Highly reliable whether you are catching intraday waves on a 5-minute chart or managing long-term trend extensions on daily layouts.
How to Trade with the KC Channel Indicator
Integrating the color-coded KC Channel framework into your daily operations opens the door to two popular execution models:
- The Trend Continuation Bounce: When the channel is colored blue and sloping upward, treat the center line or lower band as a high-probability loading zone for long (buy) positions. Conversely, during a coral-shaded markdown phase, prioritize short (sell) setups as the price pullbacks test the upper boundaries.
- The Momentum Breakout Strategy: A powerful institutional expansion often begins when a candlestick closes entirely outside the upper or lower KC band. If the channel shifts its color matrix concurrently with a breakout close, it confirms a strong surge in buying or selling pressure.
For maximum efficiency, combine your KC Channel bands with volume tools or oscillator confirmations (like the MACD or RSI) to safely filter out false structural breaks during low-volume sessions.
4 Downloads
Last Update:
May 24, 2026 02:38 AM
Published:
Jan 15, 2026 19:31 PM
Category: