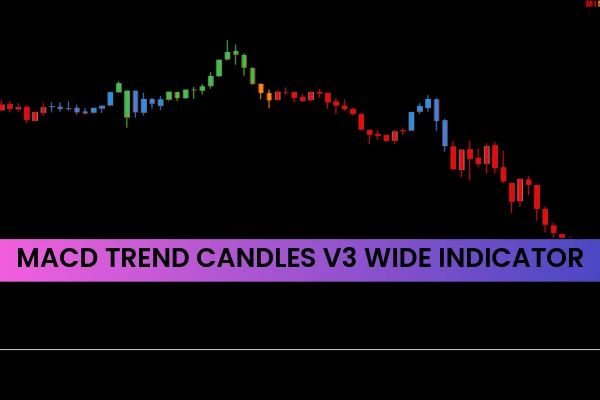
The MACD Trend Candles V3 Wide Indicator for MT4 visually represents trend direction and strength by changing candle colors according to the MACD signal line and zero line.
It helps traders instantly recognize whether the market is bullish or bearish and how strong the current trend is. The indicator is non-repainting, beginner-friendly, and works seamlessly across all chart timeframes—from intraday to weekly and monthly analysis.
How the MACD Trend Candles V3 Wide Indicator Works
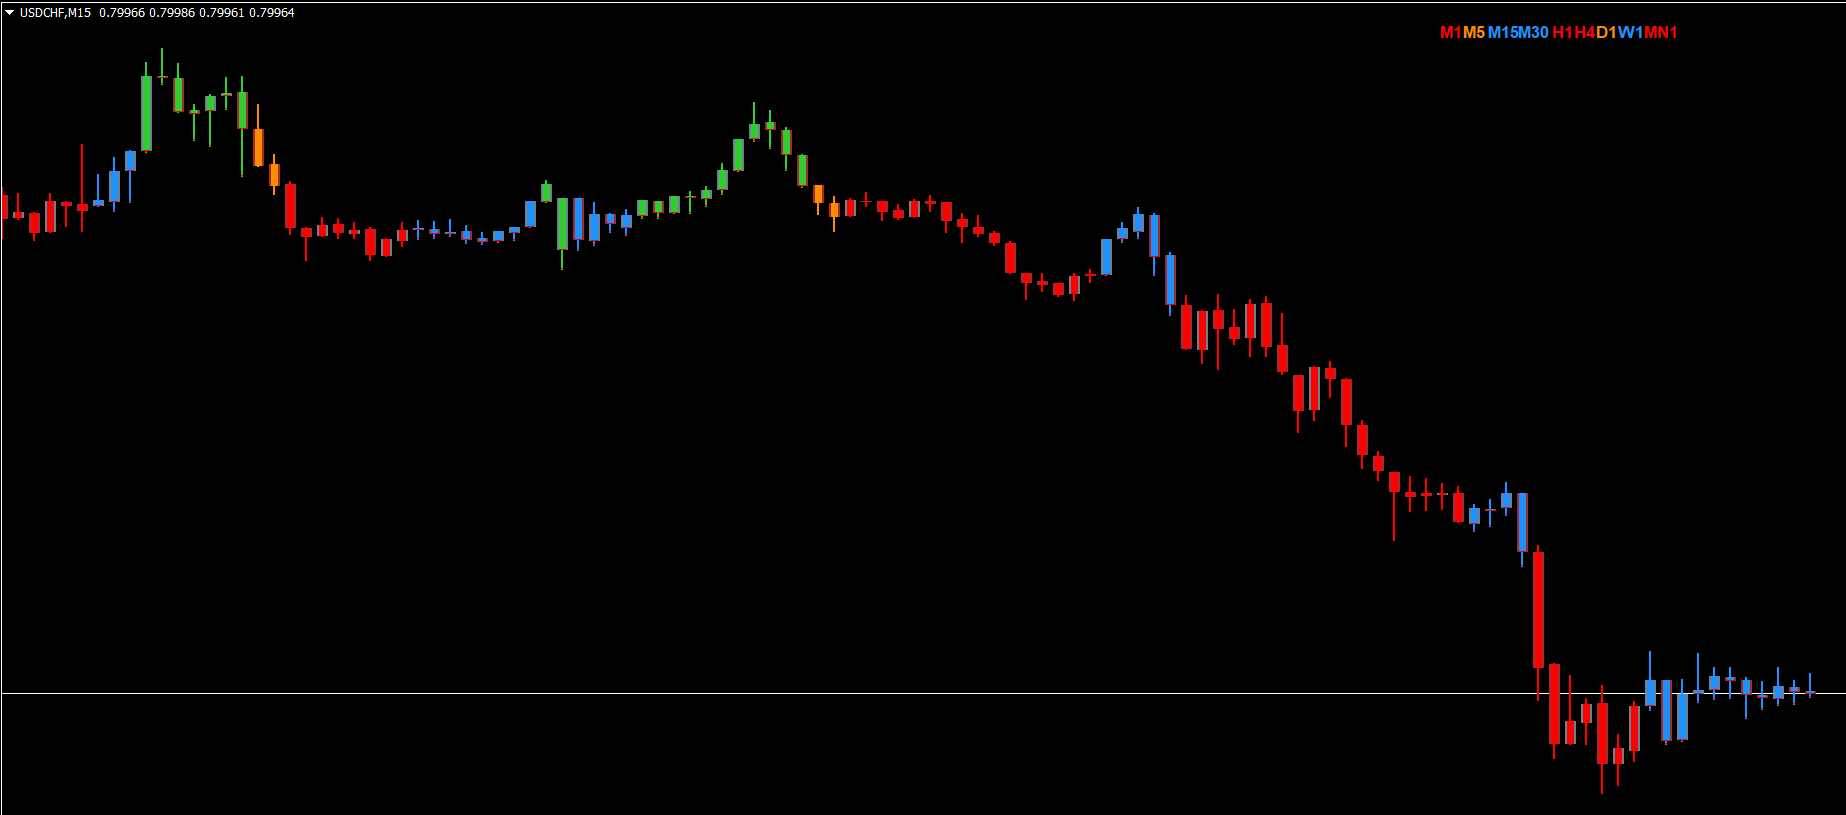
This indicator modifies the color of candlesticks based on MACD momentum and position relative to the zero line. It plots four distinct colors, each representing a unique market condition:
Green: MACD is rising above the zero line → Strong bullish trend.
Blue: MACD is rising below the zero line → Early bullish signal or weak uptrend.
Orange: MACD is falling above the zero line → Weakening bullish momentum.
Red: MACD is falling below the zero line → Strong bearish trend.
This color-based visualization allows traders to instantly understand trend direction and momentum without manually interpreting the MACD histogram.
MACD Trend Candles V3 Wide Indicator Trading Strategy
The trading strategy is simple yet powerful, based purely on color transitions:
BUY Signal
Wait for the candle to turn Green.
Confirm that MACD is rising above the zero line.
Enter a buy position and set a stop loss below the most recent swing low.
Exit or secure profits when the color changes to Orange or Red, indicating trend weakness.
SELL Signal
When the candle turns Red, it signals a strong downtrend.
Confirm MACD is below the zero line and declining.
Enter a sell trade, placing a stop loss above the last swing high.
Exit or take profit when the candle turns Blue or Green.
This method allows traders to stay with the trend until a true reversal signal appears.
Advantages of MACD Trend Candles V3 Wide Indicator
Simplifies trend identification with clear color coding.
Works across all MT4 timeframes and currency pairs.
Non-repainting – signals remain valid after candle close.
Helps both beginners and experienced traders build visual trading strategies.
Suitable for manual trading and strategy testing.
Best Settings & Tips
Default MACD settings (12, 26, 9) work well for most assets.
Combine with Support And Resistance or moving averages for stronger confirmations.
Works best on H1, H4, and D1 timeframes for trend trading.
Conclusion
The MACD Trend Candles V3 Wide Indicator for MT4 transforms ordinary candlesticks into a powerful visual trend detector. By blending MACD analysis with candle color coding, it allows traders to spot trend direction, momentum, and reversals instantly.
It’s one of the best non-repainting trend indicators for MT4 — perfect for traders who rely on visual analysis and Price Action confirmation.
✅ Download the MACD Trend Candles V3 Wide Indicator for free at IndicatorForest.com and improve your market timing today!
FAQ
6 Downloads
Published:
Nov 11, 2025 12:47 PM
Category: