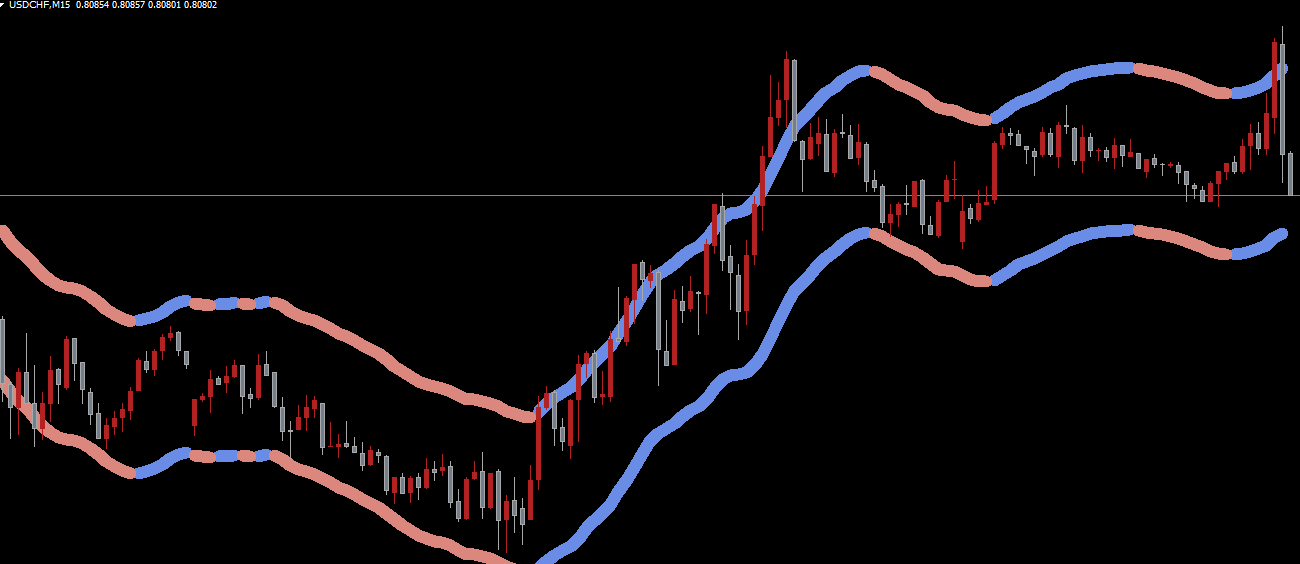
The Keltner is a channel-based trading indicator that helps traders identify potential overbought and oversold levels. Similar to Bollinger Bands or Donchian Channels, it has an upper, middle, and lower line that form a channel around Price Action.
Charles Keltner first introduced this indicator in 1960 in his book How to Make Money in Commodity Markets. The original version used a modified moving average. Later, Linda Raschke updated the indicator to use the Average True Range (ATR) to determine channel width, and Robert Colby suggested combining it with an exponential moving average (EMA). This modern version is widely used today.
Unlike Bollinger Bands, which rely on standard deviation, the Keltner Channel uses ATR. As a result, the lines are smoother, making trend detection and breakout strategies easier to interpret.
How the Keltner Works
The indicator consists of three lines:
Upper Line: Represents a potential overbought zone.
Middle Line: Typically an exponential moving average, representing the trend.
Lower Line: Represents a potential oversold zone.
Traders often use the Keltner Channel to identify extreme market conditions. Prices moving far outside the channel may indicate that the market is at an extreme, potentially signaling a reversal. However, in strong trends, price can remain overbought or oversold for extended periods, so context is important.
Keltner Trading Strategy
Buy Setup
Wait for the price to approach a support level.
Observe Keltner Channel compression—price squeezed between the middle and lower lines.
Open a long position on a breakout above the compression zone.
Place stop-loss below the lower channel line.
Set take profit near the next resistance level.
Sell Setup
Wait for the price to approach a resistance level.
Look for Keltner Channel compression—price squeezed between the middle and upper lines.
Open a short position on a breakout below the compression zone.
Place stop-loss above the upper channel line.
Set take profit near the next support level.
The Keltner Channel Squeeze, where price is between the middle line (20 EMA) and the outer channel line, often signals an imminent breakout, offering high-probability trading opportunities.
Tips for Trading With the Keltner Channel
Avoid counter-trend trades when price closes outside the outer channel during strong trends.
Combine the Keltner Channel with other indicators such as RSI or MACD for confirmation.
Use higher timeframes for trend confirmation and lower timeframes for precise entries.
Always set stop-losses and calculate risk-to-reward ratios before entering trades.
By following these rules, traders can use the Keltner Channel to improve entry timing, spot reversals, and trade breakouts effectively.
Conclusion
The Keltner Indicator is a versatile channel trading tool that allows traders to identify overbought and oversold conditions, monitor trend direction, and anticipate breakouts. With smoother ATR-based lines, it provides clear visual cues for trend continuation or reversal. Using Keltner Channel compression and breakouts in combination with key Support And Resistance levels can significantly improve trading accuracy.
FAQ
The Keltner Indicator is a channel-based trading tool that helps traders identify potential overbought and oversold levels. It consists of three lines: an upper line representing a potential overbought zone, a middle line (typically an exponential moving average) representing the trend, and a lower line representing a potential oversold zone. Unlike Bollinger Bands, it uses ATR for smoother lines.
For Buy Setup: wait for price to approach a support level, observe Keltner Channel compression (price squeezed between middle and lower lines), open a long position on a breakout above the compression zone, place stop-loss below the lower channel line, and set take profit near the next resistance level. For Sell Setup: wait for price to approach resistance, look for compression between middle and upper lines, open a short position on a breakout below compression zone, place stop-loss above the upper channel line, and set take profit near the next support level.
The Keltner Channel Squeeze occurs when price is between the middle line (20 EMA) and the outer channel line, often signaling an imminent breakout and offering high-probability trading opportunities. This compression indicates that price is consolidating and preparing for a significant move, making it an ideal entry point for breakout strategies.
Combine the Keltner Channel with other indicators such as RSI or MACD for confirmation. Use higher timeframes for trend confirmation and lower timeframes for precise entries. Always set stop-losses and calculate risk-to-reward ratios before entering trades. Avoid counter-trend trades when price closes outside the outer channel during strong trends.
Unlike Bollinger Bands which rely on standard deviation, the Keltner Channel uses ATR (Average True Range) to determine channel width. As a result, the lines are smoother, making trend detection and breakout strategies easier to interpret. The modern version combines exponential moving average with ATR-based channel width for improved accuracy.
1 Download
Published:
Dec 13, 2025 02:18 AM
Category: