Mastering the Market Squeeze: Trading Range Breakouts with the Konsolidierung Indikator
One of the most challenging environments for retail trend followers is a sideways market. During periods of consolidation, asset prices compress into tight horizontal bands, stripping momentum from the market and rendering standard trend indicators highly inefficient. Traders who attempt to catch moves during these phases are frequently trapped by deceptive micro-breakouts and continuous whipsaws, resulting in unnecessary account drawdown. The Konsolidierung Indikator for MT4/MT5 tackles this engineering challenge directly. By dynamically computing localized volatility boundaries, this on-chart technical tool provides day traders and high-frequency scalpers with a clear, visual framework to isolate flat ranges and exploit high-probability expansion waves.
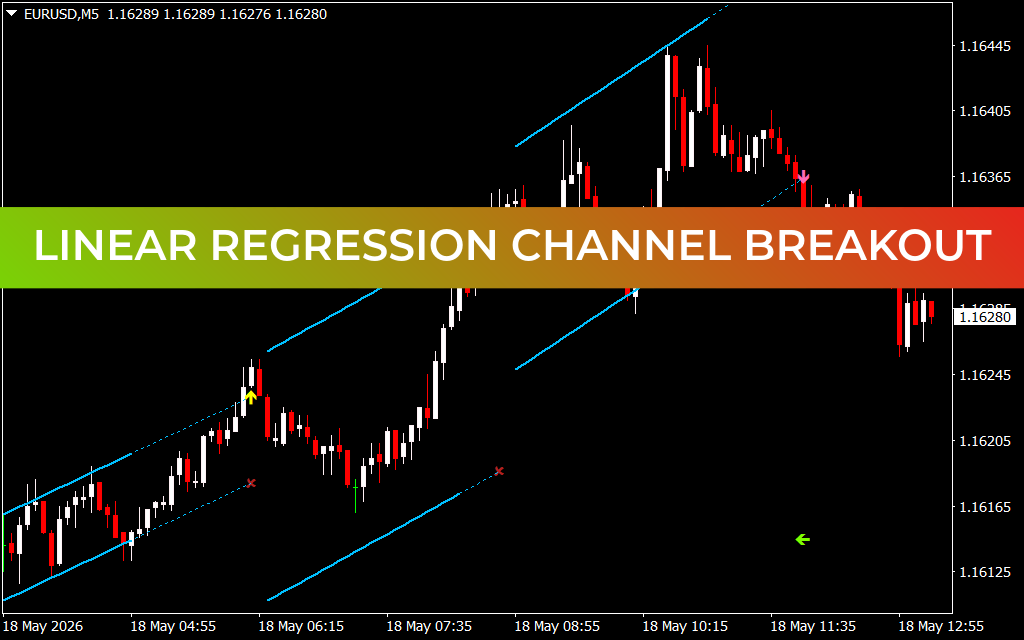
Analyzing Channel Geometry on the EUR/USD M5 Chart
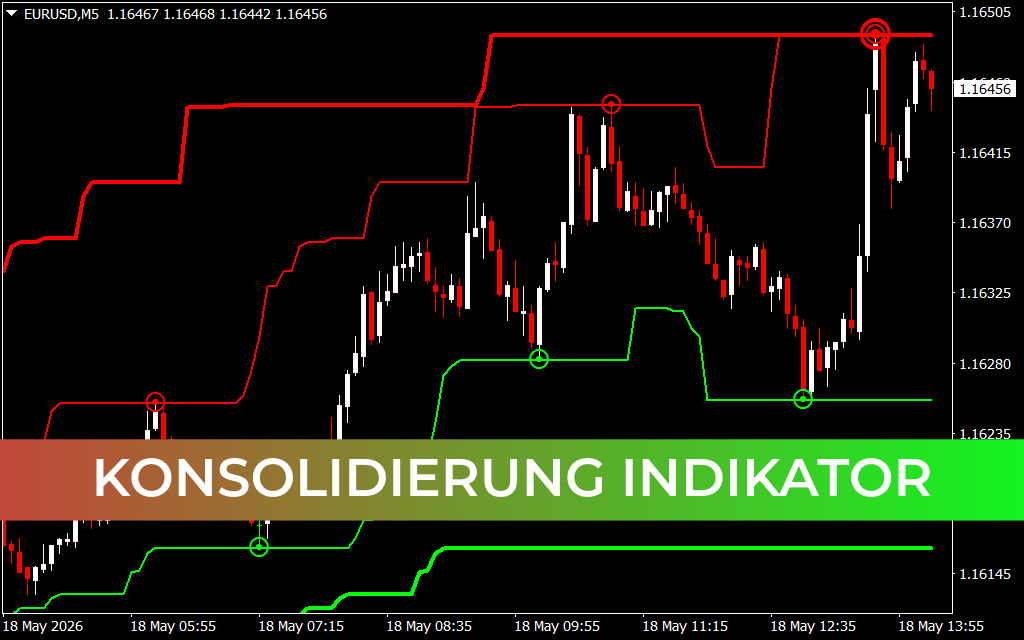
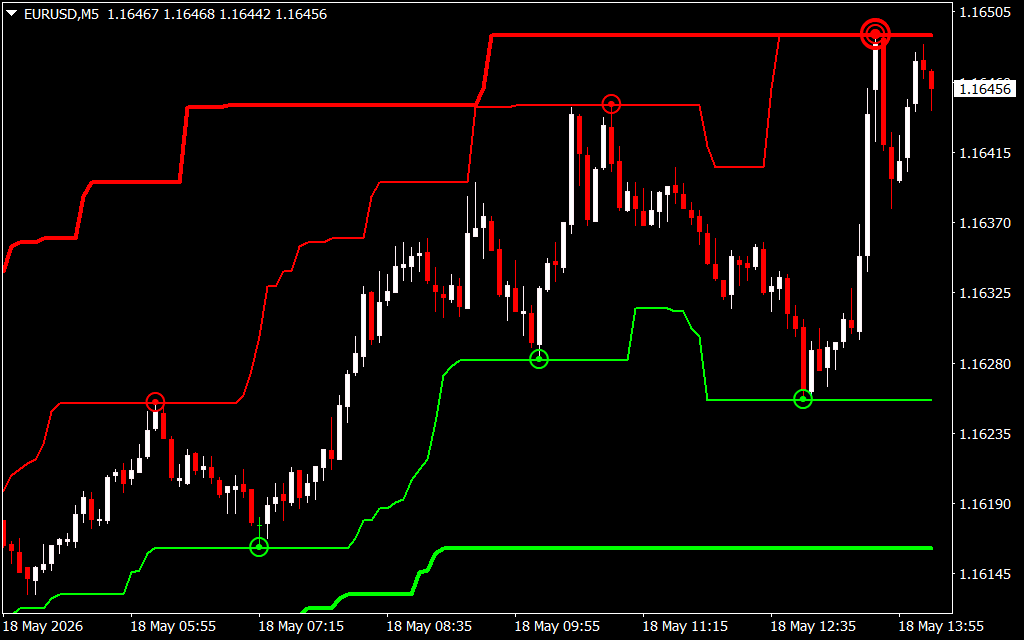
The attached EUR/USD 5-minute (M5) chart showcases the profound analytical clarity the Konsolidierung Indikator brings to fast-moving intraday workspaces. Plotted directly over the price candlesticks, the indicator establishes dual-band structural channels composed of a red upper resistance threshold and a green lower support threshold, marked by precision tracking circles at critical swing points.
During the early morning session of May 18, the currency pair entered a prolonged accumulation phase. Following an initial push up from the 1.16145 region, the price compressed tightly into a sideways band, carving out a structural baseline between 1.16200 and 1.16280.
In a standard charting setup, identifying the precise parameters of a consolidation block relies on subjective discretionary drawing tools. The Konsolidierung Indikator automates this process cleanly. Notice how its algorithm locks onto the range boundaries, printing green support circles along the lower floor and a red resistance circle near 1.16280. This distinct channel informs technical operators that the market is inside a low-volatility squeeze, signaling a rule-based environment to stand aside until a definitive breakout materializes.
Executing High-Velocity Breakouts with Rules-Based Precision
The true strategic edge of the Konsolidierung Indikator is revealed the exact moment institutional volume flows back into the asset, triggering a powerful trend lifecycle. Around the 08:35 session marker, aggressive buying pressure entered the market, driving Price Action cleanly through the upper red resistance line.
As the price candlesticks sustained an expansion leg past 1.16325, the red indicator band reacted dynamically, stepping upward in an escalating staircase pattern to map out the newly established bullish structure. This immediate shift confirms that the consolidation phase has concluded and a valid markup phase is underway, allowing trend traders to confidently execute long entries. The pair proceeded to embark on a massive vertical run, ultimately driving up to tap a macro session ceiling near 1.16474.
Risk management becomes entirely objective with this tool. When trading a consolidation breakout, day traders can utilize the green lower channel line as an automated invalidation boundary to set tight protective stop-loss orders. By integrating the Konsolidierung Indikator into your daily trading terminal, you eliminate structural guesswork, shield your capital during flat market conditions, and capture explosive momentum extensions with absolute precision.
5 Downloads
Last Update:
May 18, 2026 17:17 PM
Published:
Jan 19, 2026 21:17 PM
Category: