The KVO for MetaTrader 4, otherwise known as the Klinger Volume Oscillator indicator, is a custom trading tool with a semblance like the traditional MACD but works differently. It was built with algorithms that evaluate and compare the volume force of the price with that of the market trend and then paint a histogram bar afterward. The bars reflect the primary directional bias of an asset.
This oscillator indicator depicts a bullish/bearish trend when the histogram bars are above/below the zero line mark, respectively. Similarly, the red (signal) line also functions as a confluence to confirm a bullish/bearish sentiment when it crosses above/below the zero line.
Furthermore, the indicator can be used by novice/intermediate and advanced forex traders to interpret the market sentiments and reversal zones. However, it is recommended to be used in synergy with Price Action/other technical indicators for better efficiency.
How to Trade With the KVO Indicator
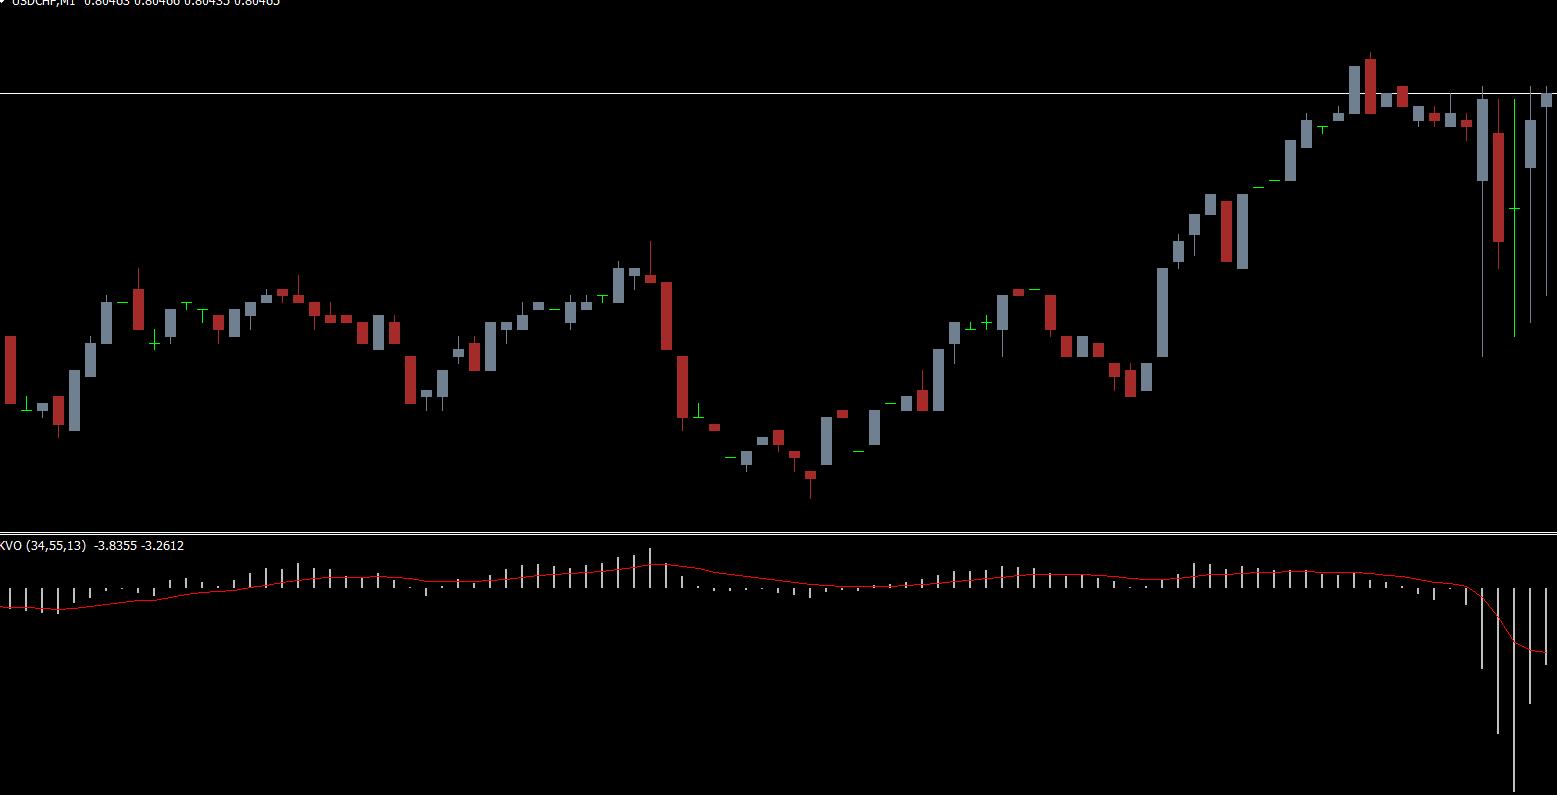
The above image depicts the action of the indicator on the EURUSD currency pair in the H4 time frame. It illustrates how a high-probability sell signal/entry was identified using price action and the indicator’s signals.
Firstly, the image shows that the market is currently bearish (downtrend). Furthermore, the indicator’s bars and the signal line were below the zero line, which also depicts a bearish trend. Finally, the price printed a bearish order block and retested it, which also doubles as the sell signal.
Conclusion
The KVO indicator for MT4 is a simple but incredible trading tool that identifies the true direction of a trend and the reversal zones. What’s more, it is recommended for both scalpers and day/intraday traders. Finally, it is free to download.
FAQ
Published:
Dec 07, 2025 01:30 AM
Category: