implifying Trend Analysis with the Leader EMA Indicator for MT
Identifying the precise direction of a market trend is one of the most critical steps in technical analysis. For traders using the MetaTrader 4 (MT4) platform, moving averages serve as foundational tools to filter price noise. However, standard moving averages can suffer from lag. The Leader EMA indicator tackles this challenge by introducing a dynamic, color-changing trend line that helps traders visually track shifts in momentum in real time.
By updating its visual profile relative to price behavior, this indicator offers a clean, distraction-free approach to trend-following strategies.
How the Leader EMA Indicator Works
The Leader EMA indicator calculates an exponential moving average (EMA) but enhances it with an adaptive color-coded mechanism. This allows traders to quickly interpret market conditions without looking at secondary oscillator windows.
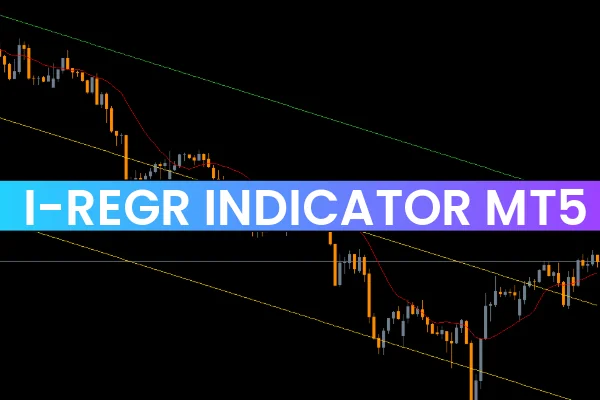
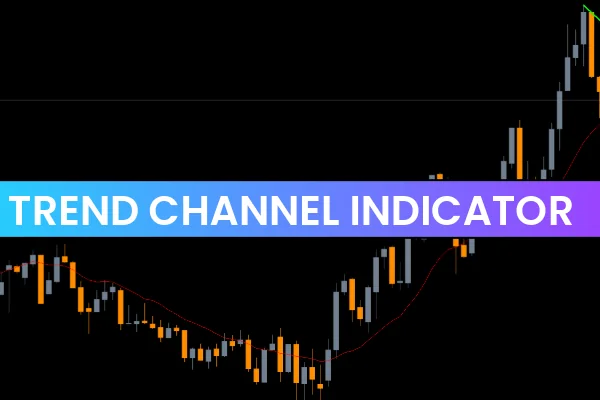
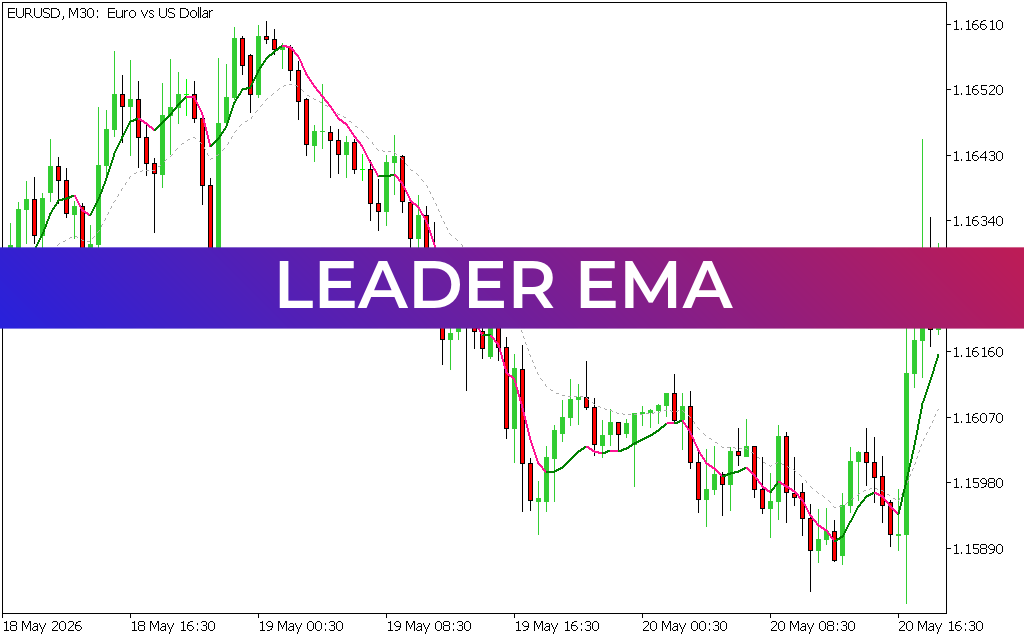
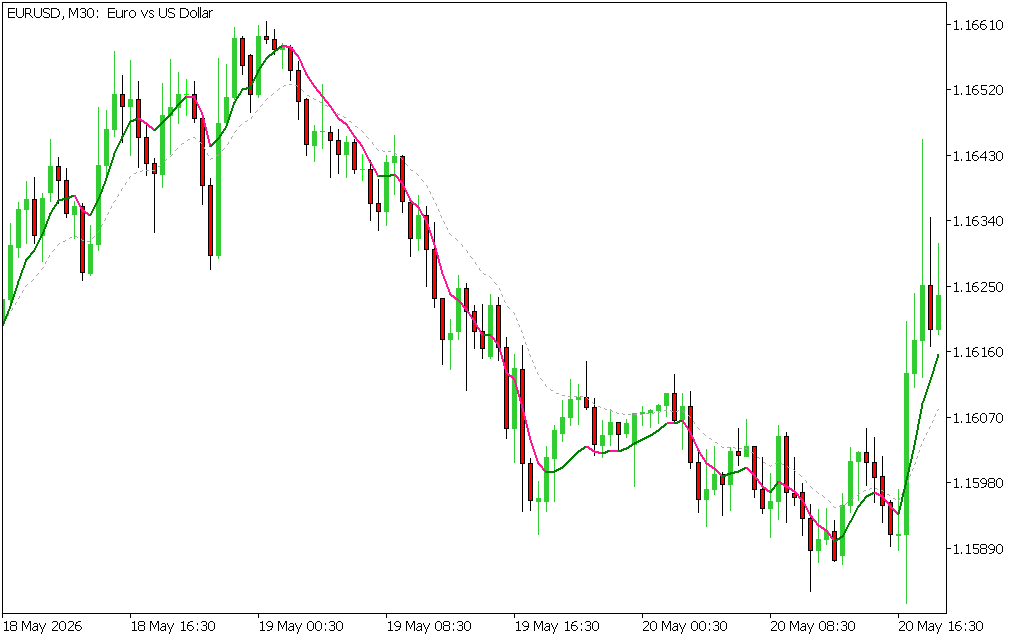
- The Color-Changing Moving Average Line: The core line changes color depending on the slope and price position. A green line reflects upward, bullish momentum, while a magenta line signals a downward, bearish phase.
- The Baseline Reference Line (Dotted Gray): The indicator features a subtle, dotted gray baseline. The interaction between the color-changing leader line and this baseline helps traders gauge whether a trend is accelerating or slowing down.
This dual-line system helps traders filter out minor price consolidations, keeping the focus entirely on sustained directional moves.
Core Trading Signals with Leader EMA
Integrating the Leader EMA into a trading workflow relies on straightforward rules, making it highly effective for both beginners and experienced trend followers.
1. Identifying Bullish Trends (Buy Entries)
A bullish shift is confirmed when the indicator line turns green and begins sloping upward. This transition shows that current buyers are driving the asset's price higher than its recent historical average. Traders often use this color switch as a green light to seek buying opportunities, waiting for the price to remain above both the green line and the dotted baseline for maximum confirmation.
2. Identifying Bearish Trends (Sell Entries)
Conversely, a bearish shift occurs when the indicator line turns magenta and slopes downward. This indicates escalating selling pressure in the market. When the line changes to magenta, it serves as a technical cue that momentum has flipped to the downside. Traders look to short the asset or protect open profits by tightening stop-losses during these phases.
Maximizing Strategy Performance
To get the most out of the Leader EMA indicator, consider incorporating these classic technical analysis best practices:
- Multi-Timeframe Analysis: Use the indicator on higher timeframes, such as the 30-minute (M30) or 1-hour (H1) charts, to identify the major trend, then use a lower timeframe to execute precise entries matching that direction.
- Price Rejection Confirmation: Watch how candlesticks react when they pull back to the green or magenta line. A bounce off the line accompanied by a strong rejection wick adds extra confirmation to the trend's strength.
- Strict Risk Control: Always position stop-loss orders outside the recent swing highs or lows, ensuring your trading capital is protected if the market suddenly reverses against the indicator's signal.
1 Download
Last Update:
May 22, 2026 20:59 PM
Published:
Jan 17, 2026 14:16 PM
Category: