Enhance Your Trading Precision with the MACD Colored Histogram MT4
The Moving Average Convergence Divergence (MACD) has long been a staple in the toolkit of professional traders. However, the standard MACD available in MetaTrader 4 can often feel visually flat, making it difficult to spot subtle shifts in momentum at a glance. The MACD Colored Histogram MT4 is a modern optimization of this classic oscillator, designed to provide immediate visual feedback on market strength, trend exhaustion, and potential reversals.
The Power of Visual Momentum
Unlike the traditional version that uses a single-color histogram, the MACD Colored Histogram utilizes a multi-color logic to represent the acceleration and deceleration of price momentum. This is critical for traders who need to make split-second decisions in fast-moving markets like Forex, Commodities, or Indices.
The indicator typically follows a intuitive four-color logic:
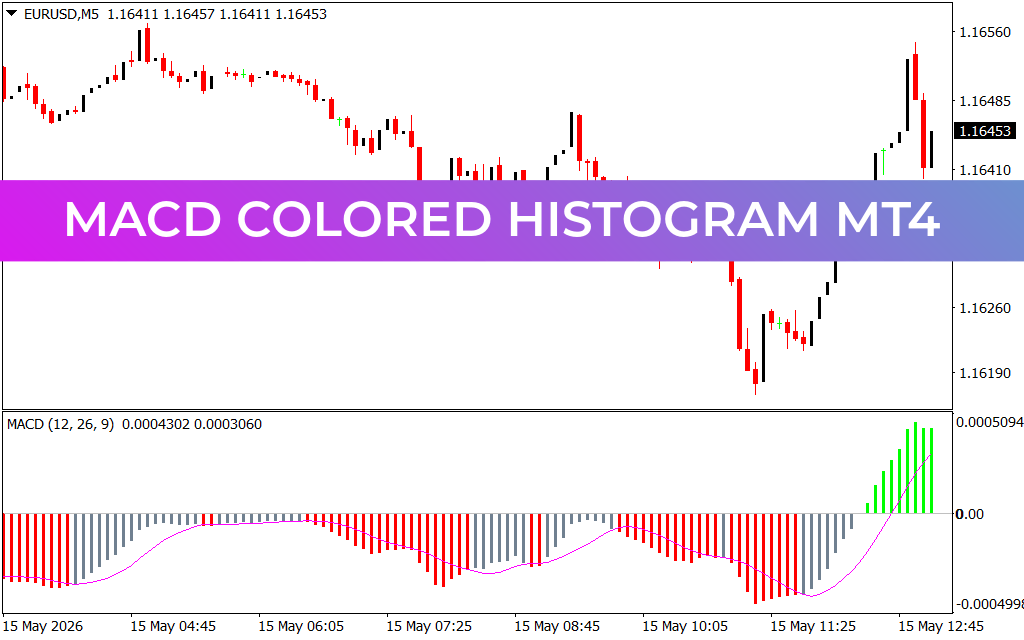
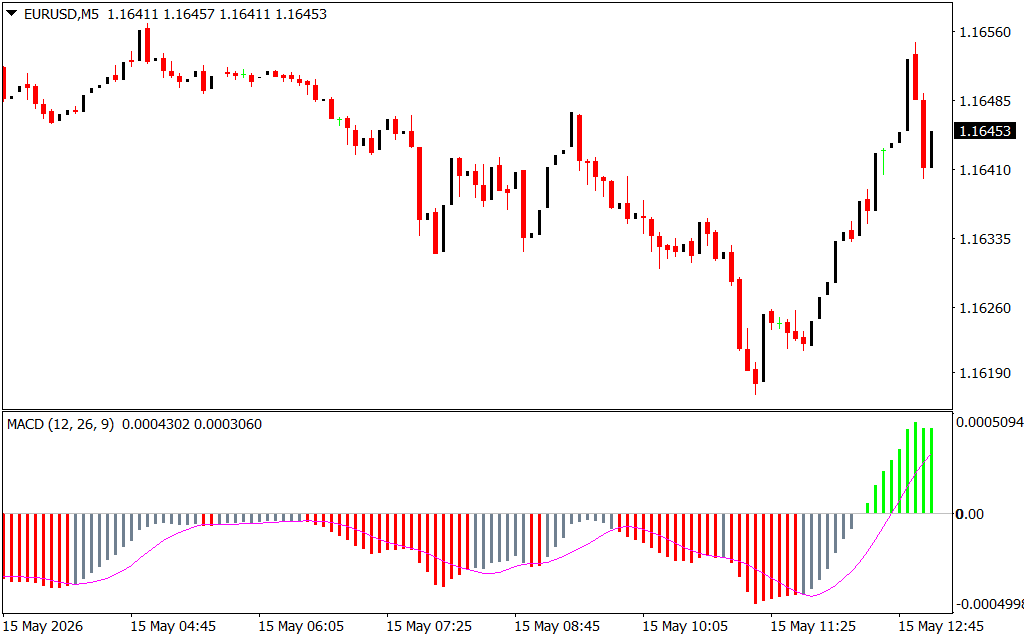
- Bright Green: Strong bullish momentum (the trend is accelerating upward).
- Dark Green: Weakening bullish momentum (a potential pullback or consolidation).
- Bright Red: Strong bearish momentum (the trend is accelerating downward).
- Dark Red: Weakening bearish momentum (potential exhaustion of the selling pressure).
By tracking these color changes, traders can identify "hidden" weakness in a trend before the price actually turns, allowing for tighter stop-losses and more precise exit points.
Key Trading Signals and Implementation
The MACD Colored Histogram excels at identifying three primary types of market setups:
- Zero-Line Crossovers: When the histogram bars move from below the zero line to above it, it signals a bullish shift in the long-term trend. Conversely, moving from above to below indicates a bearish regime change.
- Signal Line Crossovers: The inclusion of a smoothed signal line (often shown as a magenta or signal-colored line) provides crossover entries. A histogram color change combined with a signal line cross is a high-confluence entry trigger.
- Divergence Detection: This is perhaps the most powerful use of the MACD. When the price makes a higher high, but the MACD Colored Histogram makes a lower high (highlighted by a color shift to dark green), it signals a classic bearish divergence. This often precedes significant market reversals.
Scalping vs. Swing Trading
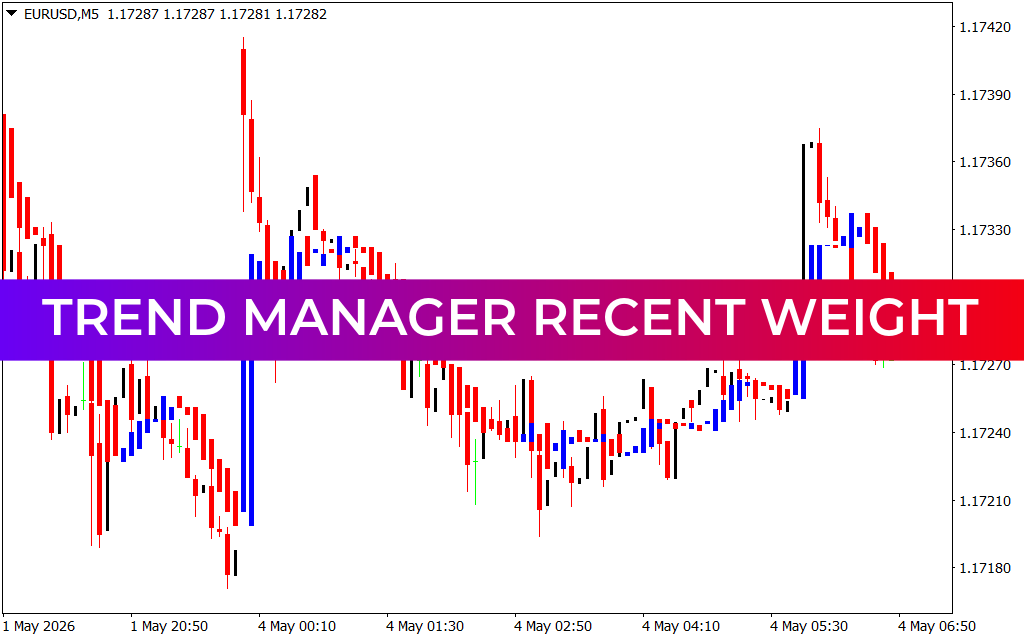
As demonstrated in the EURUSD M5 chart, the MACD Colored Histogram is exceptionally effective for Scalping. It filters out the "market noise" that often plagues lower timeframes. By waiting for a "Bright Green" or "Bright Red" bar to confirm momentum, scalpers can avoid entering during low-volatility periods.
For swing traders, the indicator serves as a reliable trend-following tool. By only taking trades in the direction of the dominant color on the H1 or H4 charts, traders can significantly improve their risk-to-reward ratios.
In a world where speed and clarity are paramount, the MACD Colored Histogram MT4 transforms a traditional lag-heavy oscillator into a responsive, visual dashboard of market psychology.
5 Downloads
Last Update:
May 15, 2026 16:09 PM
Published:
Jan 21, 2026 20:21 PM
Category: