Mastering Trend Explosions with the Mt4 Donchian Breakout Indicator
In technical analysis, trading consolidations can be an incredibly frustrating endeavor. Price frequently moves sideways, chopping account balances away before a definitive move takes place. Professional momentum traders overcome this hurdle by ignoring minor intraday noise and focusing strictly on structural range expansions. The Mt4 Donchian Breakout indicator streamlines this process by calculating historic price boundaries and delivering real-time, highly visual breakout alerts directly to your MetaTrader workspace.
The Core Mechanics of Donchian Channels
Invented by legendary futures trader Richard Donchian, standard Donchian Channels plot the highest high and the lowest low of a specific historical period (typically 20 days) across your charts. This creates an organic, price-derived channel that outlines the exact parameters of market equilibrium:
- The Upper Bound: Tracks the maximum price point buyers could achieve over the chosen lookback period.
- The Lower Bound: Tracks the lowest price point sellers forced the asset down to over that same period.
When Price Action remains coiled within these lines, the market is in equilibrium. However, when price punches through either boundary, it signals a dramatic shift in market psychology. A breach of the channel means institutional supply or demand has fundamentally overwhelmed the opposition, paving the way for a powerful new macro trend.
Visualizing Institutional Flow via Color-Coded Zones
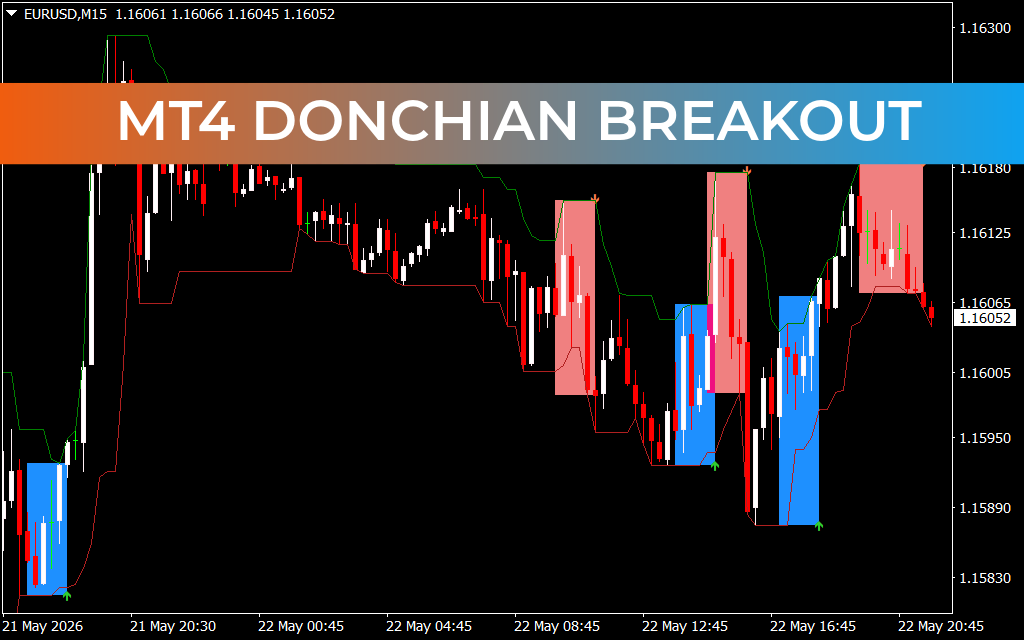
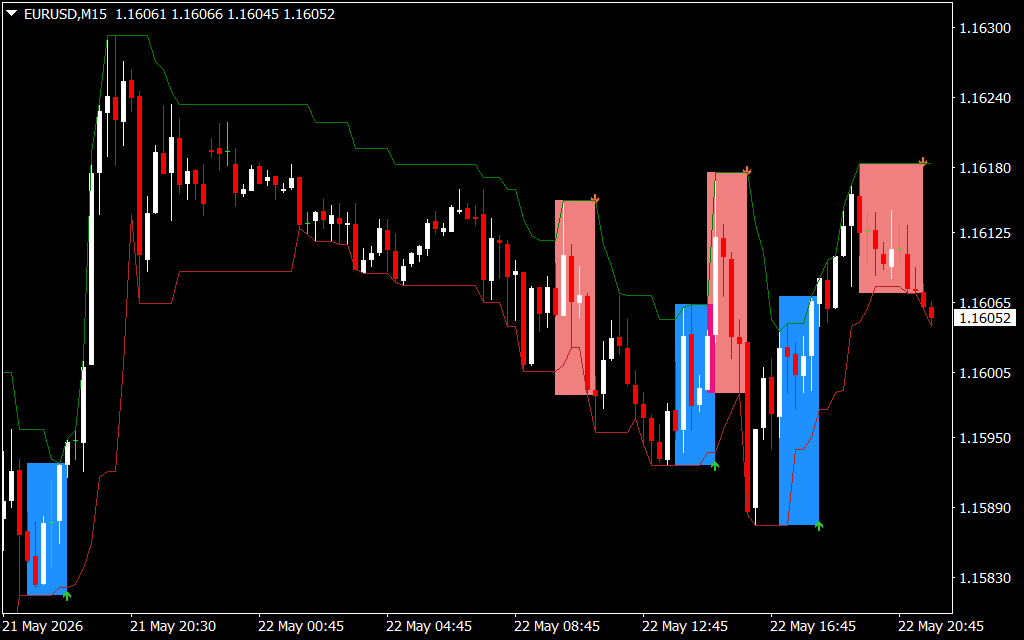
As demonstrated on the EURUSD 15-minute (M15) chart, the Mt4 Donchian Breakout Indicator enhances the classic channel formula by transforming standard lines into a dynamic, color-coded execution map. Instead of forcing you to guess when a true breakout occurs, the indicator dynamically highlights institutional volume blocks:
- Vibrant Blue Structural Blocks: Highlight verified bullish breakouts. Accompanied by a supportive green arrow at the absolute base of the move, these zones indicate that price has broken above historical resistance, confirming a high-probability buying environment.
- Muted Red Structural Blocks: Highlight verified bearish breakouts. Marked by an orange downward arrow at the absolute ceiling of the expansion, these regions indicate that historical support has collapsed, signaling a market markdown where short positions dominate.
By enclosing these expansion phases in clean, filled vertical boxes, the indicator tracks how long momentum remains active, giving you a crystal-clear picture of trend health.
Executing a Rules-Based Breakout Strategy
The Mt4 Donchian Breakout indicator serves as an outstanding standalone trend-capture mechanism or as a high-confluence entry tool within a Smart Money Concepts (SMC) framework.
For maximum consistency, breakout traders can look for price to compress tightly within the green upper and red lower stepped channel bands. Once a candle closes decisively outside the boundary, triggering a blue or red momentum block, you can safely enter in the direction of the expansion. The opposite channel line provides a mathematically sound, unmoving location for a protective stop-loss, ensuring absolute risk management and emotional discipline on every trade.
3 Downloads
Last Update:
May 24, 2026 02:08 AM
Published:
Jan 15, 2026 20:12 PM
Category: