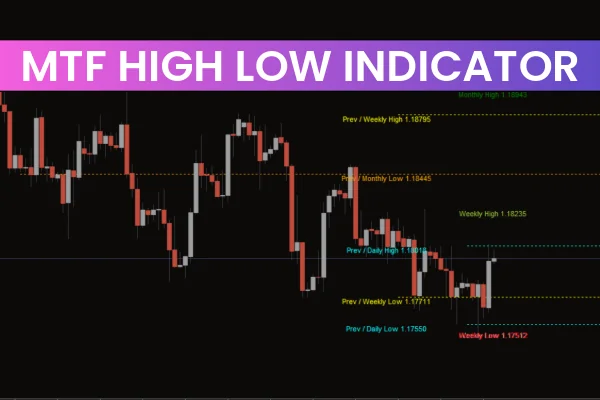
The MTF High Low Indicator for MT4 is one of the most useful multi-timeframe tools for traders who need a clear view of the market’s structure. By plotting the previous and current daily, weekly, and monthly highs and lows, along with pivot levels, it gives forex traders a powerful snapshot of overall market direction. This makes it easier to identify strong bullish and bearish zones, key turning points, and potential entry and exit setups.
The indicator also shades each timeframe (daily, weekly, monthly) on the chart using rectangular boxes. These zones help traders visually recognize market sentiment and structure while applying any technical strategy. Because it works on all timeframes, the MTF High Low Indicator for MT4 is suitable for both beginners and advanced traders.
How the MTF High Low Indicator for MT4 Works
The indicator automatically reads higher-timeframe data and projects them onto your current chart. Instead of switching between charts repeatedly, traders get all essential levels in one place, including:
Previous Day High & Low
Current Day High & Low
Weekly High & Low
Monthly High & Low
Daily, Weekly & Monthly Pivot Points
Shaded multi-timeframe zones
This structure helps traders identify whether the market is currently trending upward, downward, or consolidating.
Why Multi-Timeframe High and Low Levels Matter
Higher-timeframe highs and lows play a critical role in market analysis because:
These levels often act as Supply And Demand zones
Breakouts from these levels indicate market strength
Rejections from these levels reveal weakening trends
Trend Continuation and reversal patterns begin around major highs and lows
By using the MTF High Low Indicator for MT4, traders get instant access to all of these important points without manual plotting.
Benefits of Using the MTF High Low Indicator for MT4
Clear Trend Identification
When price stays above the daily, weekly, or monthly pivot, it indicates a strong bullish sentiment. When price stays below, the market leans bearish. The indicator makes this trend direction visually obvious.
Better Entry and Exit Points
Highs and lows from higher timeframes often become major turning points. Traders can use these levels to set precise buy and sell entries, stop losses, and take-profit targets.
Perfect for Any Strategy
Whether using Price Action, SMC concepts, breakout trading, pivot trading, or scalping, these multi-timeframe levels help enhance decision-making.
Works on All Timeframes
From scalpers to swing traders, everyone can benefit. The indicator adapts automatically without requiring manual calculations.
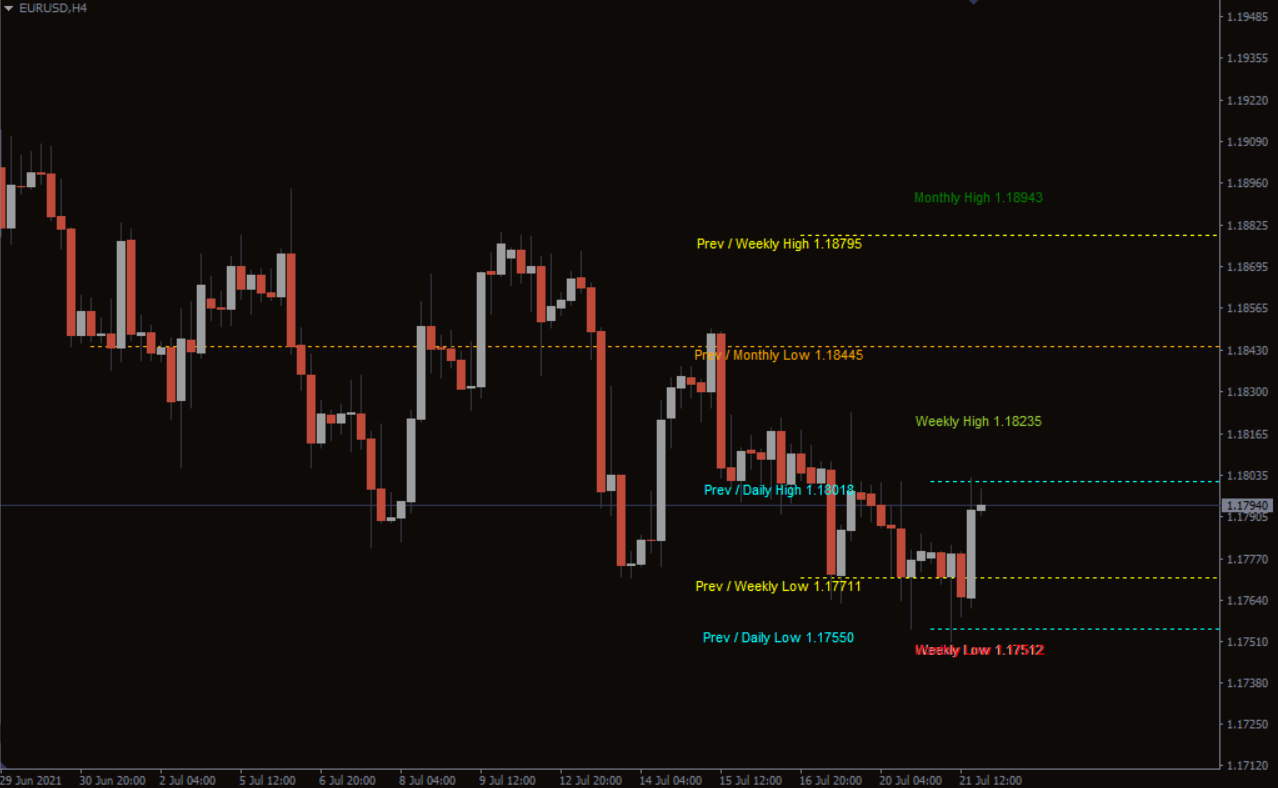
MTF High Low Indicator for MT4 Trading Setup (Example)
In the EURUSD H4 chart example, the MTF High Low Indicator for MT4 projects higher-timeframe highs, lows, and pivots. Pivot traders can analyze weekly and monthly levels to determine the larger trend, then drop to lower timeframes such as M30 or M15 to find precise entries.
Key takeaways from the setup:
Weekly highs often act as strong resistance
Daily lows can form short-term support
Pivot points guide directional bias
Trend continuation trades become easier when price breaks and retests these levels
This makes the indicator extremely practical for trend-following strategies, reversal setups, and range trading.
Conclusion
The MTF High Low Indicator for MT4 offers a complete multi-timeframe perspective that every trader needs. By displaying highs, lows, pivots, and shaded zones, the indicator simplifies trend reading and strategic decision-making. It is free to download, easy to install, and suitable for any trading approach.
For more powerful MT4 and MT5 tools, visit IndicatorForest.com and explore our premium and free indicators.
FAQ
4 Downloads
Published:
Dec 01, 2025 22:30 PM
Category: