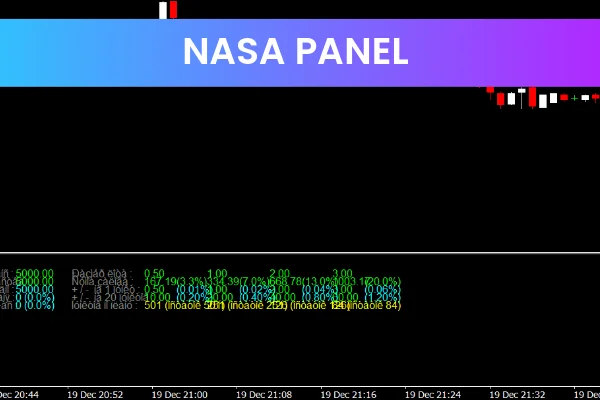
The NASA Panel Indicator is a popular and free Forex Indicator designed for the MetaTrader 4 platform. It is built to help traders analyze market conditions quickly by presenting critical trading data in a clean, easy-to-read panel. Instead of switching between multiple indicators and charts, traders can rely on the NASA Panel Indicator to get a complete market overview from one place.

This indicator is suitable for all types of traders, including scalpers, day traders, and swing traders. By combining trend direction, Price Action, volatility, market sentiment, and trade status into a single visual dashboard, the NASA Panel Indicator helps traders make faster and more informed trading decisions.
How the NASA Panel Indicator Works level
The NASA Panel Indicator analyzes real-time market data and organizes it into a structured panel displayed directly on the MT4 chart. Each section of the panel represents a different aspect of the market, allowing traders to assess conditions at a glance.
The trend component is shown using a colored line that reflects the current market direction. This makes it easy to determine whether the market is bullish, bearish, or neutral. The price action section uses a histogram to visualize recent price movement, helping traders understand momentum and short-term behavior.
Volatility is displayed using a dotted line, indicating how active the market currently is. Higher volatility suggests stronger price movements, while lower volatility may signal consolidation or ranging conditions. Market sentiment is represented by a colored line that reflects the overall bias of market participants, helping traders align their positions with prevailing sentiment.
In addition to market analysis, the NASA Panel Indicator also shows current open positions and pending orders. This feature is especially useful for traders managing multiple trades, as it allows them to monitor trade status without opening additional windows.
Key Features and Benefits
Displays market trend direction clearly
Visualizes price action using a histogram
Shows real-time market volatility
Indicates overall market sentiment
Displays open positions and pending orders
Easy-to-read dashboard layout
Reduces chart clutter
Works on all currency pairs and timeframes
Free to download and use on MT4
Using the NASA Panel Indicator Effectively
To use the NASA Panel Indicator, traders simply attach it to any MT4 chart. Once applied, the indicator automatically analyzes the market and displays the information in the panel without requiring manual configuration. Traders can customize visual settings such as colors and panel size to suit their preferences.
This indicator works best as a market overview and confirmation tool. Traders often use it alongside technical indicators such as moving averages, oscillators, or Support And Resistance levels. For example, a trader may identify a trend using the NASA Panel Indicator and then wait for a price action signal or indicator confirmation before entering a trade.
Because it displays volatility and sentiment, the NASA Panel Indicator can also help traders avoid low-quality setups. Low volatility conditions may suggest waiting for clearer opportunities, while strong sentiment alignment can increase confidence in a trade idea.
Why Traders Choose the NASA Panel Indicator
The NASA Panel Indicator is popular because it simplifies market analysis without sacrificing important information. Instead of interpreting multiple indicators separately, traders receive a unified market snapshot that supports better decision-making.
Its dashboard-style presentation makes it ideal for traders who value efficiency and clarity. Whether monitoring one chart or multiple currency pairs, the NASA Panel Indicator helps traders stay organized and focused.
Because it is free, easy to use, and compatible with all MT4 platforms, the NASA Panel Indicator is a valuable addition to any Forex trading toolkit.
To download the NASA Panel Indicator and explore more powerful MT4 tools, visit IndicatorForest.com and improve your Forex trading experience today.
FAQ
Published:
Dec 21, 2025 07:32 AM
Category: