Maximize Your Gains with the NRTR V1 Trading Indicator
Riding a strong market trend is one of the most profitable ways to trade forex, but knowing exactly where to enter and when to exit is a constant challenge. Trailing stops manually can lead to emotional decisions, causing you to close trades too early or hold onto losing positions too long. The NRTR V1 (Nick Rypock Trailing Reverse) indicator for MetaTrader is engineered to solve this dilemma, offering an automated, mathematical approach to trend-following and risk management.
What is the NRTR V1 Indicator?
The NRTR V1 is a dynamic trend-following tool that calculates a trailing support or resistance line based on price percentage deviations from market extremes (peaks and troughs). Unlike static moving averages, the NRTR V1 adjusts dynamically to market volatility, plotting clear visual dots that help traders lock in profits while giving trades enough breathing room to develop.
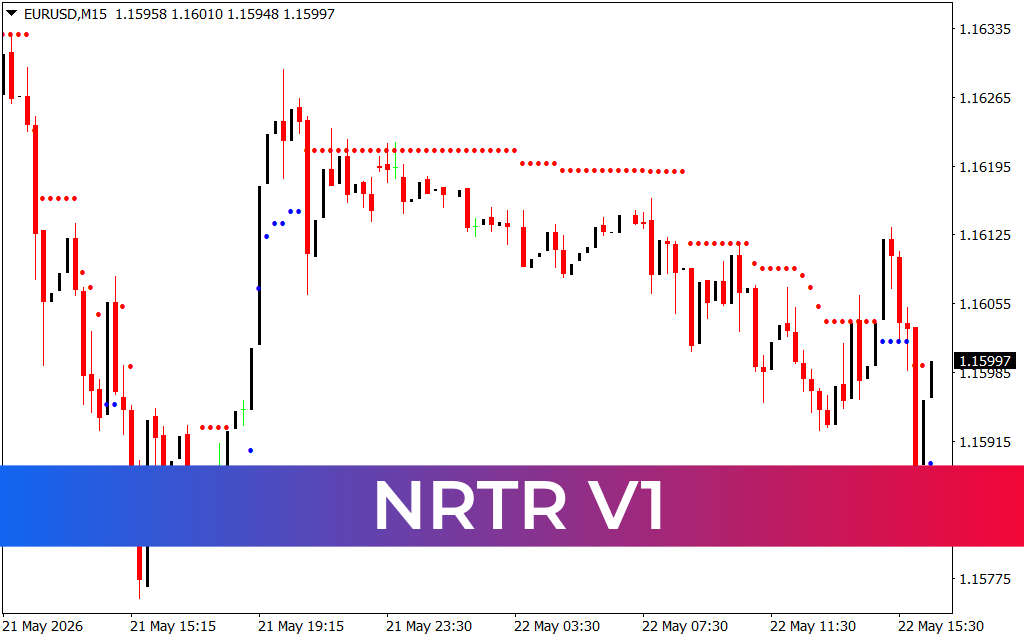
As displayed on the EURUSD M15 chart, the indicator provides instant visual confirmation of the dominant market bias:
- Blue Dots Below Price: Indicate a strong bullish trend. These dots act as a dynamic trailing support level where buyers remain in control.
- Red Dots Above Price: Indicate a clear bearish trend. These dots act as a dynamic trailing resistance line where sellers dominate the order flow.
When the price breaks through the active dot barrier, the indicator instantly reverses its position and changes color, signaling that the current trend has exhausted itself and a new reversal is underway.
Key Technical Features and Advantages
- Objective Trailing Stops: Eliminates the emotional guesswork of trade management by giving you a clear, rule-based level to place your stop-losses.
- Dynamic Volatility Tracking: The algorithm responds directly to Market Structure, tightening up during low-volatility consolidations and widening during aggressive expansions.
- Instant Visual Reversal Alerts: The distinct shift from red to blue dots makes it incredibly simple to identify major market inflection points at a glance.
- Clean Chart Profile: By utilizing minimal dot formations, it integrates seamlessly with your favorite oscillators, volume tools, or candlestick pattern strategies.
How to Trade Successfully with NRTR V1
To implement the NRTR V1 indicator into a highly profitable trading system, combine its algorithmic lines with Price Action fundamentals:
- Trend Inception: Watch for the moment price breaks through a resistance barrier. For instance, when a candlestick closes decisively above a line of red dots, and the indicator prints its first blue dot, a bullish entry is triggered.
- Set and Forget Stop-Losses: When you enter a buy position, place your protective stop-loss exactly on or just below the current blue dot line. As the market moves in your favor, trail your stop up along with the rising blue dots to guarantee risk-free trading.
- Bypassing the Chop: During prolonged horizontal distributions (such as the price action around the 1.16195 area), the dots flatten out. This tells smart traders to reduce position sizes or wait on the sidelines until a definitive breakout occurs.
By aligning your trade execution with institutional momentum, the NRTR V1 helps you eliminate bad habits and execute trend-following strategies with absolute clinical discipline.
3 Downloads
Last Update:
May 22, 2026 19:45 PM
Published:
Jan 17, 2026 18:49 PM
Category: