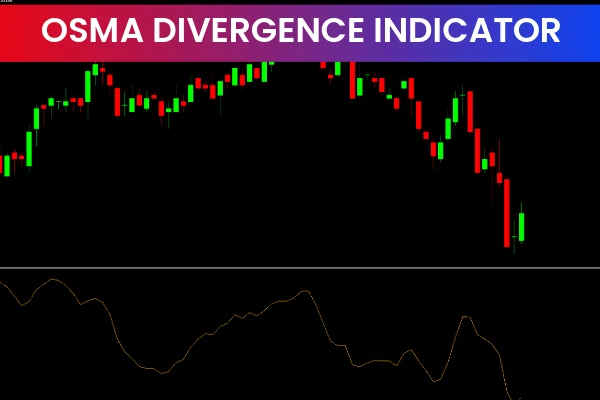
The OsMA Divergence Indicator is a popular and free Forex indicator for the MT4 platform that helps traders identify potential market reversals through divergence analysis. Divergence occurs when Price Action moves in one direction while momentum indicators move in another, often signaling a possible trend change.
By combining the MACD (Moving Average Convergence/Divergence) with the OsMA (Oscillator of Moving Average), the OsMA Divergence Indicator offers traders a powerful way to analyze market momentum and uncover high-probability trading opportunities. Its clear visual signals and simple structure make it suitable for both novice and experienced traders.
What Is the OsMA Divergence Indicator?
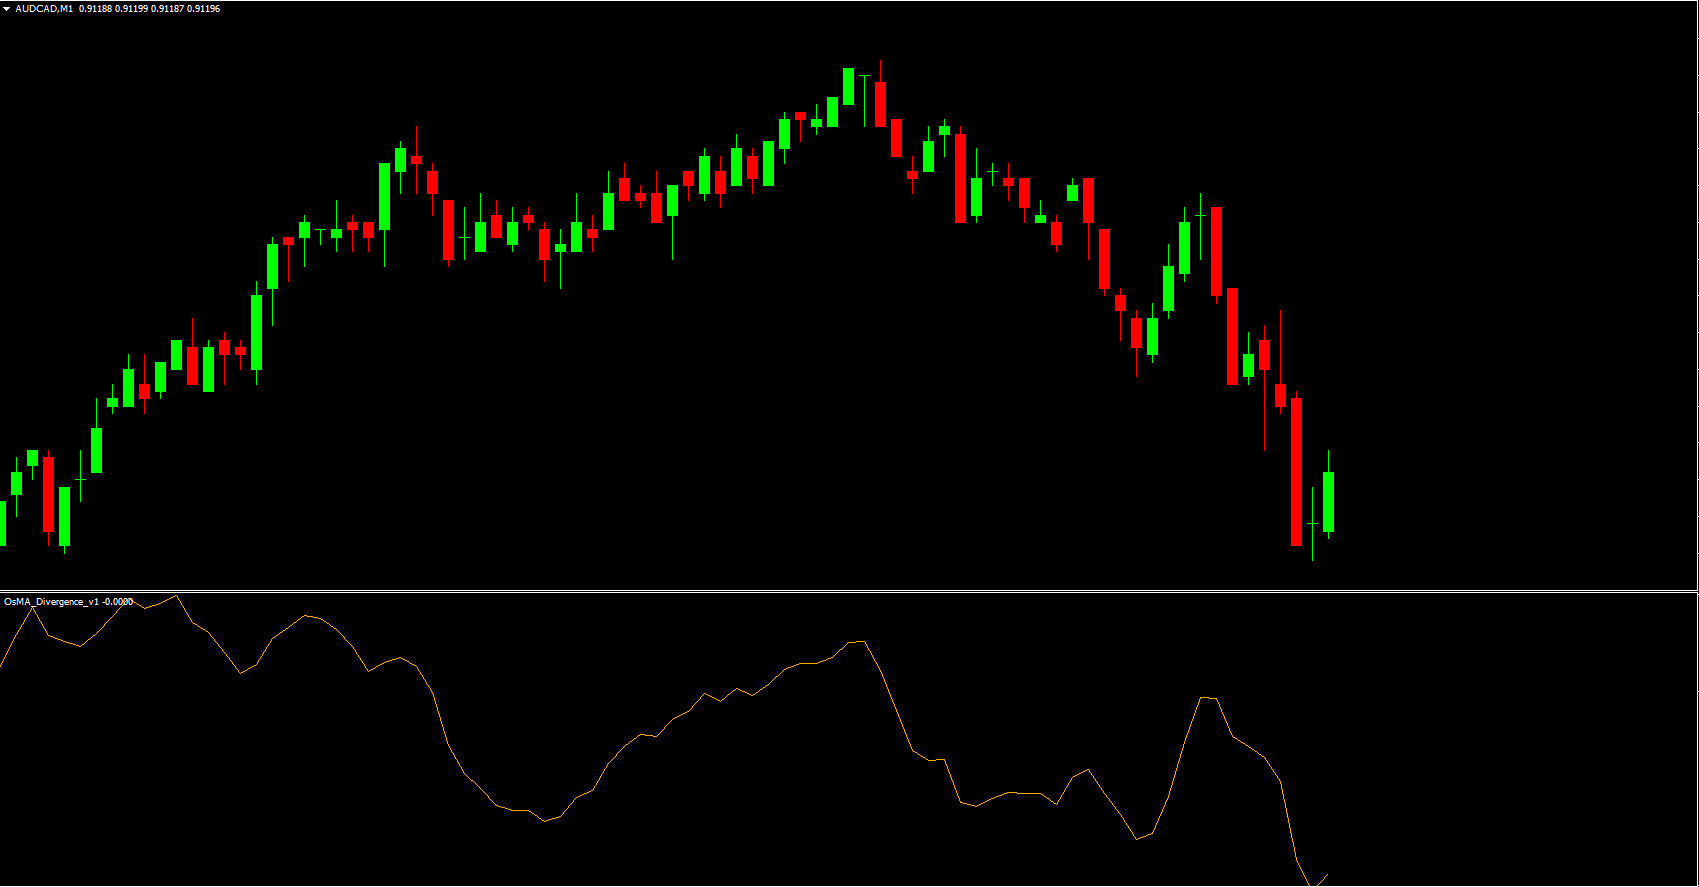
The OsMA Divergence Indicator is a momentum-based trading tool that plots both the MACD and OsMA on the same chart. The MACD is a trend-following indicator that measures market momentum, while the OsMA represents the difference between two moving averages derived from the MACD.
By analyzing the interaction between these two indicators, traders can identify bullish and bearish divergences that often precede price reversals or strong corrective moves.
How the OsMA Divergence Indicator Works
The indicator displays the MACD and OsMA lines together, allowing traders to visually assess momentum shifts.
Key divergence signals include:
Bullish Divergence: Occurs when price makes lower lows while the MACD crosses above the OsMA line, signaling potential upward movement.
Bearish Divergence: Occurs when price makes higher highs while the MACD crosses below the OsMA line, signaling potential downward movement.
These divergence signals help traders anticipate trend changes before they become obvious on the price chart.
Main Features of the OsMA Divergence Indicator
MACD and OsMA Combined
By plotting both indicators together, the OsMA Divergence Indicator provides a deeper view of market momentum and trend strength.
Clear Divergence Detection
Bullish and bearish divergences are easy to spot, allowing traders to react quickly to potential trading opportunities.
Trend and Momentum Insight
The indicator not only highlights divergence but also helps traders understand whether momentum supports or contradicts the current trend.
Free and MT4 Compatible
The OsMA Divergence Indicator is free to use and fully compatible with the MT4 trading platform.
How the OsMA Divergence Indicator Can Benefit You
Early Reversal Identification
Divergences often appear before price reversals. The OsMA Divergence Indicator helps traders spot these signals early, improving trade timing.
Better Trade Entries and Exits
By identifying bullish and bearish divergence, traders can plan more accurate entry and exit points, reducing risk and improving reward potential.
Suitable for All Experience Levels
Its visual simplicity makes the indicator easy to understand for beginners, while its analytical depth appeals to advanced traders.
Works Across Timeframes
The indicator can be applied to multiple timeframes, making it useful for Scalping, swing trading, and longer-term strategies.
Using the OsMA Divergence Indicator in Bullish Markets
In bullish conditions, traders look for bullish divergence when price forms lower lows but the MACD crosses above the OsMA line. This suggests weakening selling pressure and a possible upward reversal. Traders often wait for additional confirmation before entering buy trades.
Using the OsMA Divergence Indicator in Bearish Markets
In bearish conditions, bearish divergence appears when price makes higher highs while the MACD crosses below the OsMA line. This indicates weakening buying momentum and a potential downward reversal, offering selling opportunities.
Best Practices for Trading with the OsMA Divergence Indicator
Combine with Trend Analysis
Using trendlines or moving averages alongside the OsMA Divergence Indicator helps confirm whether divergence signals align with overall Market Structure.
Avoid Low-Quality Signals
Divergence works best near key support and resistance levels. Avoid taking signals in choppy or low-volume market conditions.
Apply Risk Management
Always use stop-loss orders and proper position sizing, as divergence signals may take time to play out.
Why Use the OsMA Divergence Indicator from IndicatorForest.com?
At IndicatorForest.com, traders can find reliable and professional MT4 indicators designed to simplify technical analysis. The OsMA Divergence Indicator is an excellent tool for identifying momentum shifts, spotting reversals, and improving trading accuracy.
Call to Action:
Visit IndicatorForest.com today to explore the OsMA Divergence Indicator and discover more powerful forex trading tools to enhance your strategy.
FAQ
Published:
Dec 20, 2025 12:39 PM
Category: