Master Price Geometry with the Partizan Gann Levels M15 Indicator
In the complex world of technical analysis, few names carry as much weight as W.D. Gann. His theories on the mathematical relationship between time and price have fascinated traders for decades. However, applying these geometric principles manually can be incredibly time-consuming and prone to human error. The Partizan Gann Levels M15 Indicator automates this process, providing traders with high-precision Support And Resistance levels based on Gann’s legendary mathematical ratios.
What is the Partizan Gann Levels Indicator?
The Partizan Gann Levels indicator is a sophisticated charting tool designed to identify hidden institutional Supply And Demand zones. Unlike standard pivot points or Fibonacci retracements, Gann Levels are based on fixed geometric angles and square-of-nine calculations.
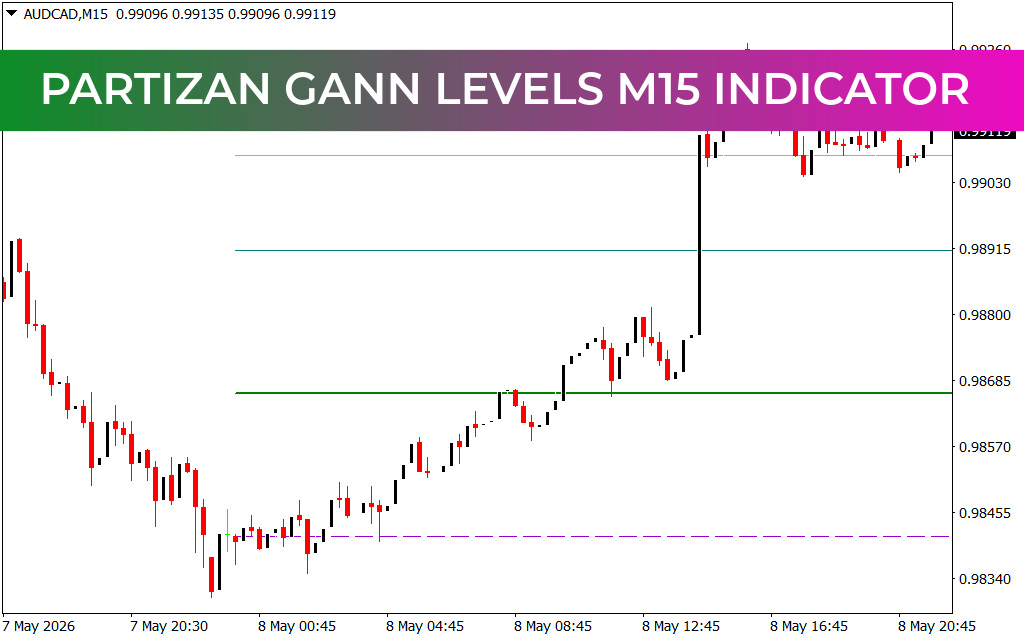
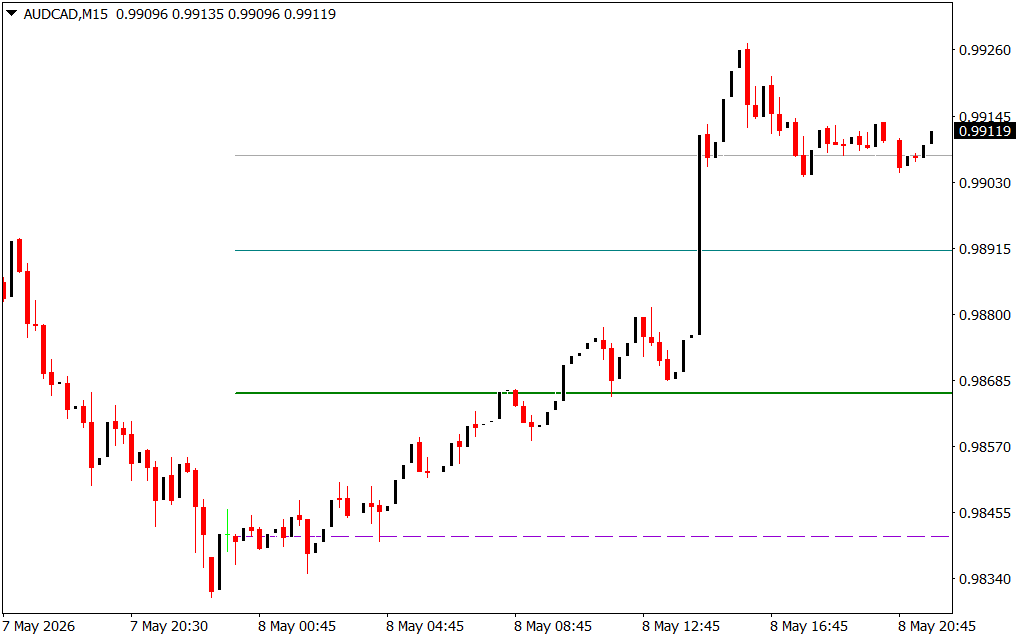
On the M15 (15-minute) timeframe, as seen in the uploaded AUDCAD chart, the indicator plots horizontal lines that represent critical decision points for the market. These levels act as "magnets" for price; the market tends to gravitate toward these lines, consolidate, and then either reject them or break through with significant momentum.
Key Features and Performance Benefits
The Partizan system is optimized for the intraday trader who requires clear, actionable data without the clutter. Its primary advantages include:
- Institutional Precision: Gann levels are frequently used by large-scale institutional traders to set limit orders. By using this indicator, retail traders can align their entries with big-bank liquidity.
- Automated Geometry: The indicator handles all the complex calculations, drawing the lines automatically as price progresses. This ensures that your levels are always mathematically accurate according to Gann's law of vibration.
- Optimized for M15: While it can work on other timeframes, the "Partizan" configuration is specifically tuned for the 15-minute chart, making it an ideal tool for day traders looking to capture high-probability swings during the London and New York sessions.
- Multi-Color Support/Resistance: As shown in the AUDCAD M15 example, the levels are often color-coded (green, blue, grey, and purple) to distinguish between major and minor mathematical significance.
Strategic Implementation for Day Trading
To trade effectively with Partizan Gann Levels, one must treat the lines as more than just horizontal markers; they are zones of high probability.
- Break and Retest: A classic strategy involves waiting for the price to break a major Gann level (such as the green or blue lines) and then waiting for a retest of that same level. If the price holds, it confirms the start of a new directional move.
- Targeting and Take Profit: Gann levels serve as excellent profit targets. If you enter a buy position at a lower purple level, the next major line above (the green level) is the most logical place to secure gains.
- Volatility Filter: If price is stuck between two Gann levels and the range is narrow, it indicates a low-volatility environment. Professional traders often wait for a breakout from this "Gann box" before committing capital.
Conclusion
The Partizan Gann Levels M15 Indicator is a bridge between ancient market wisdom and modern trading technology. By stripping away the subjectivity of manual charting and replacing it with rigid mathematical levels, it provides traders with a reliable framework for navigating the markets. Whether you are a fan of Gann’s original work or simply looking for a more accurate way to map support and resistance, this indicator is a powerful addition to your MT4 or MT5 platform.
5 Downloads
Last Update:
May 09, 2026 12:20 PM
Published:
Jan 25, 2026 12:03 PM
Category: