Pinpoint High-Probability Reversals with the Pinbar Detector Indicator
In technical Price Action Trading, few candlestick structures carry as much predictive weight as the classic pinbar. A pinbar represents a sharp, aggressive price rejection within a single time interval, signaling that institutional market makers have stepped in to drive price rapidly away from a specific key level. However, scanning multiple charts and timeframes manually for these swift rejection tells can lead to eye fatigue and missed entry windows. The Pinbar Detector indicator completely automates this process, mapping out premium reversal setups in real time.
Here is an analytical breakdown of how this automated Price Action tool functions and how to integrate its signals into a highly profitable trading framework.
What is the Pinbar Detector Indicator?
The Pinbar Detector indicator is an advanced chart scanner that analyzes live candlestick geometry the moment a bar closes. The tool evaluates the critical structural proportions of a candlestick—measuring the ratio between the long protruding tail (the shadow) and the small localized body—to verify if a valid structural rejection has occurred.
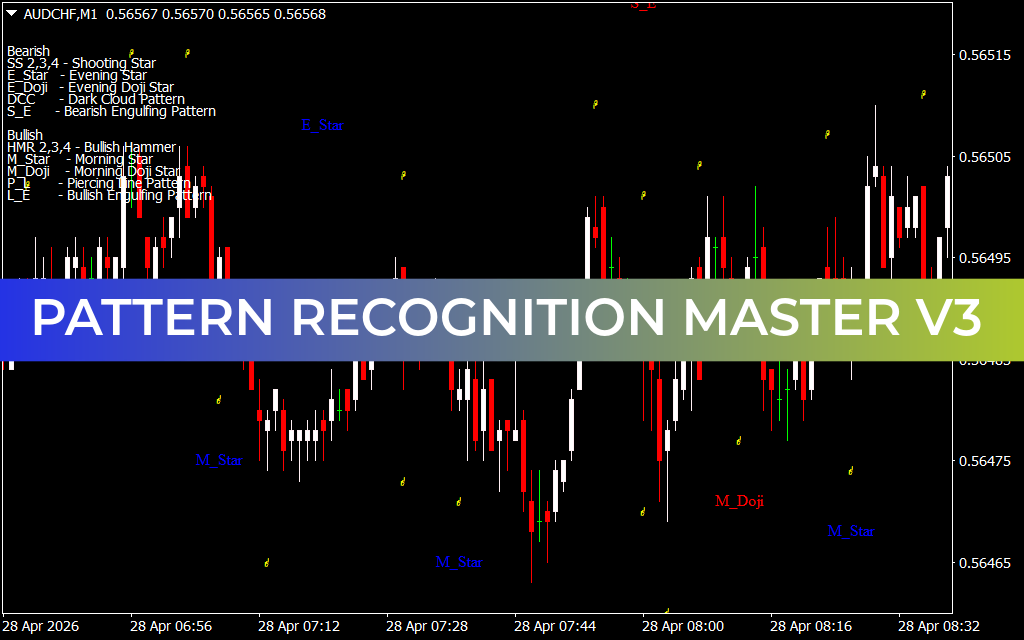
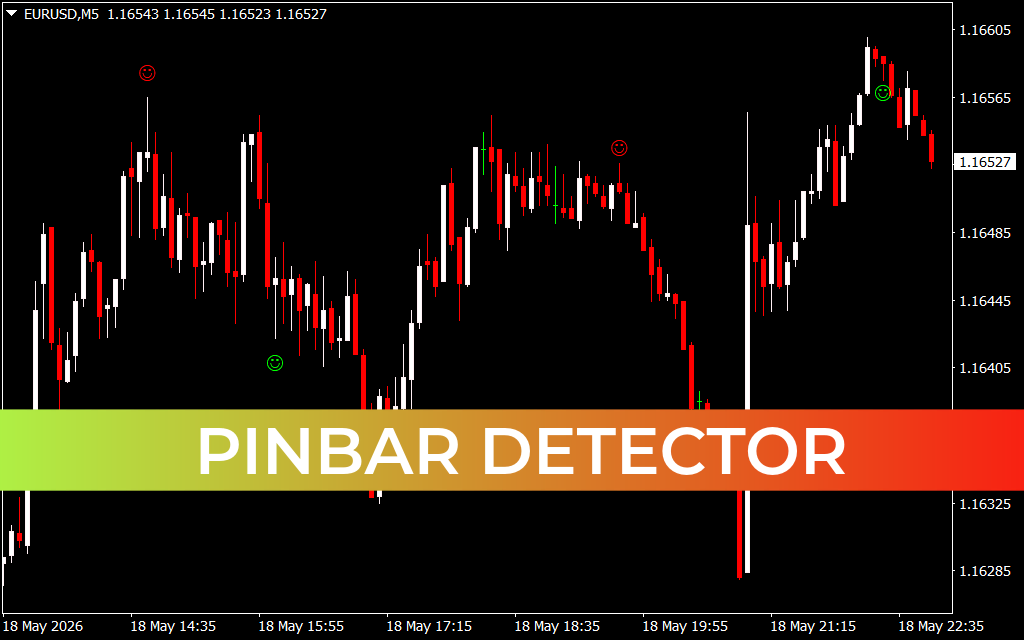
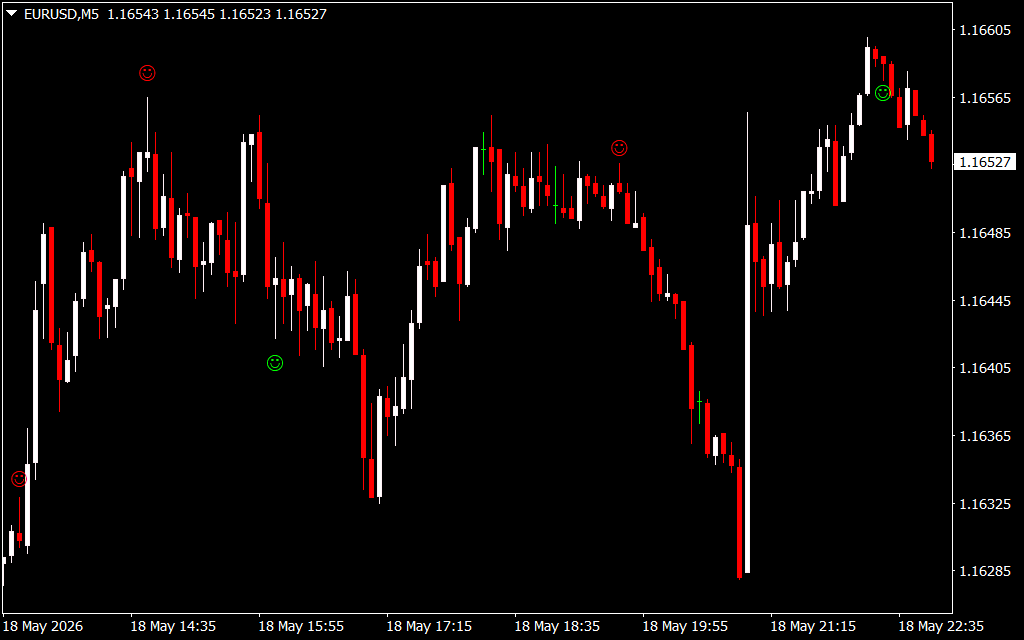
To keep your workspace clean and actionable, the indicator completely avoids complicated line drawings, instead utilizing intuitive, color-coded visual icons plotted directly above or below the asset's price candles:
- Green Smilies: Plotted directly below a candle's lower wick, these flag a high-probability bullish pinbar setup, confirming a swift rejection of lower prices.
- Red Smilies: Plotted directly above a candle's upper wick, these alert you to a valid bearish pinbar configuration, highlighting strong institutional distribution overhead.
As demonstrated on the EURUSD M5 chart, the indicator tracks volatile sessions with exceptional precision. It reliably identifies key market turning points, catching major intraday swing highs and swing lows right as a fresh trend begins to develop.
Core Strategic Advantages for Price Action Traders
- Automated Geometry Analysis: The indicator filters out weak or imperfect candles, ensuring you only execute trades on high-quality pinbars with mathematically valid risk profiles.
- Instant Visual Triggers: The simple green and red icon dashboard cuts out analytical hesitation, helping you make quick entry decisions during fast-moving trading sessions.
- Seamless Multi-Asset Utility: Because price rejection is a universal market dynamic, the indicator performs consistently across Forex pairs, stocks, crypto, and commodities.
Practical Trading Implementations
To maximize your win rate with the Pinbar Detector on platforms like MetaTrader, apply these two core execution strategies:
- The Key Level Confluence Play: Never trade pinbars blindly in sideways ranges. Instead, map out key structural Support And Resistance lines on your chart. When the Pinbar Detector prints a green smiley precisely as price tests a major horizontal support floor, treat this confluence as a high-probability long trigger. Place your protective stop-loss just below the low of the rejection tail.
- The Trend-Continuation Pullback: In an established macro trend, look for minor counter-trend pullbacks. If the broader market is heading down and a short-term upward retracement triggers a red smiley, enter a short market order on the next candle to ride the macro momentum back down.
3 Downloads
Last Update:
May 19, 2026 01:59 AM
Published:
Jan 19, 2026 20:37 PM
Category: