The Price Pattern Indicator for MT4 is a powerful Price Action tool that detects and displays key price pattern formations in the Forex market. By recognizing these patterns, traders can anticipate potential trend continuations or reversals and make more informed trading decisions.
Understanding the Price Pattern Indicator
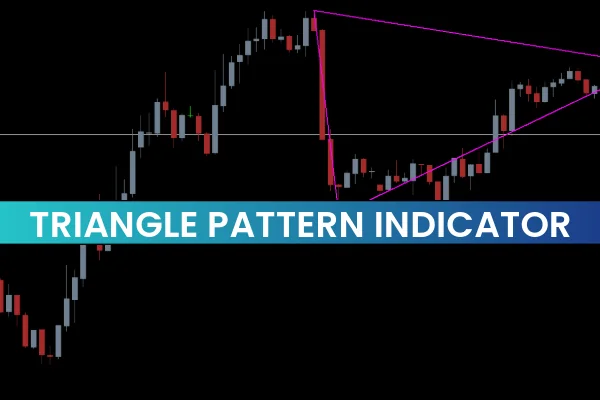
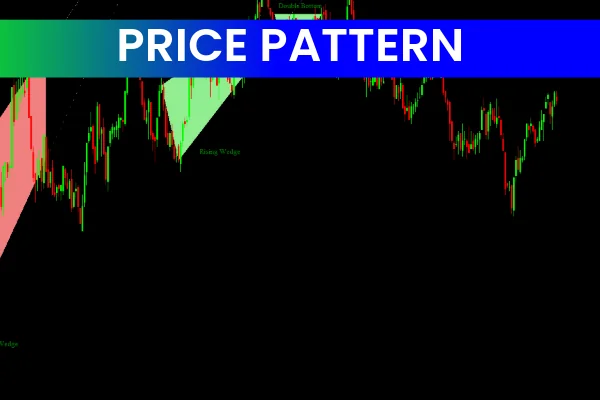
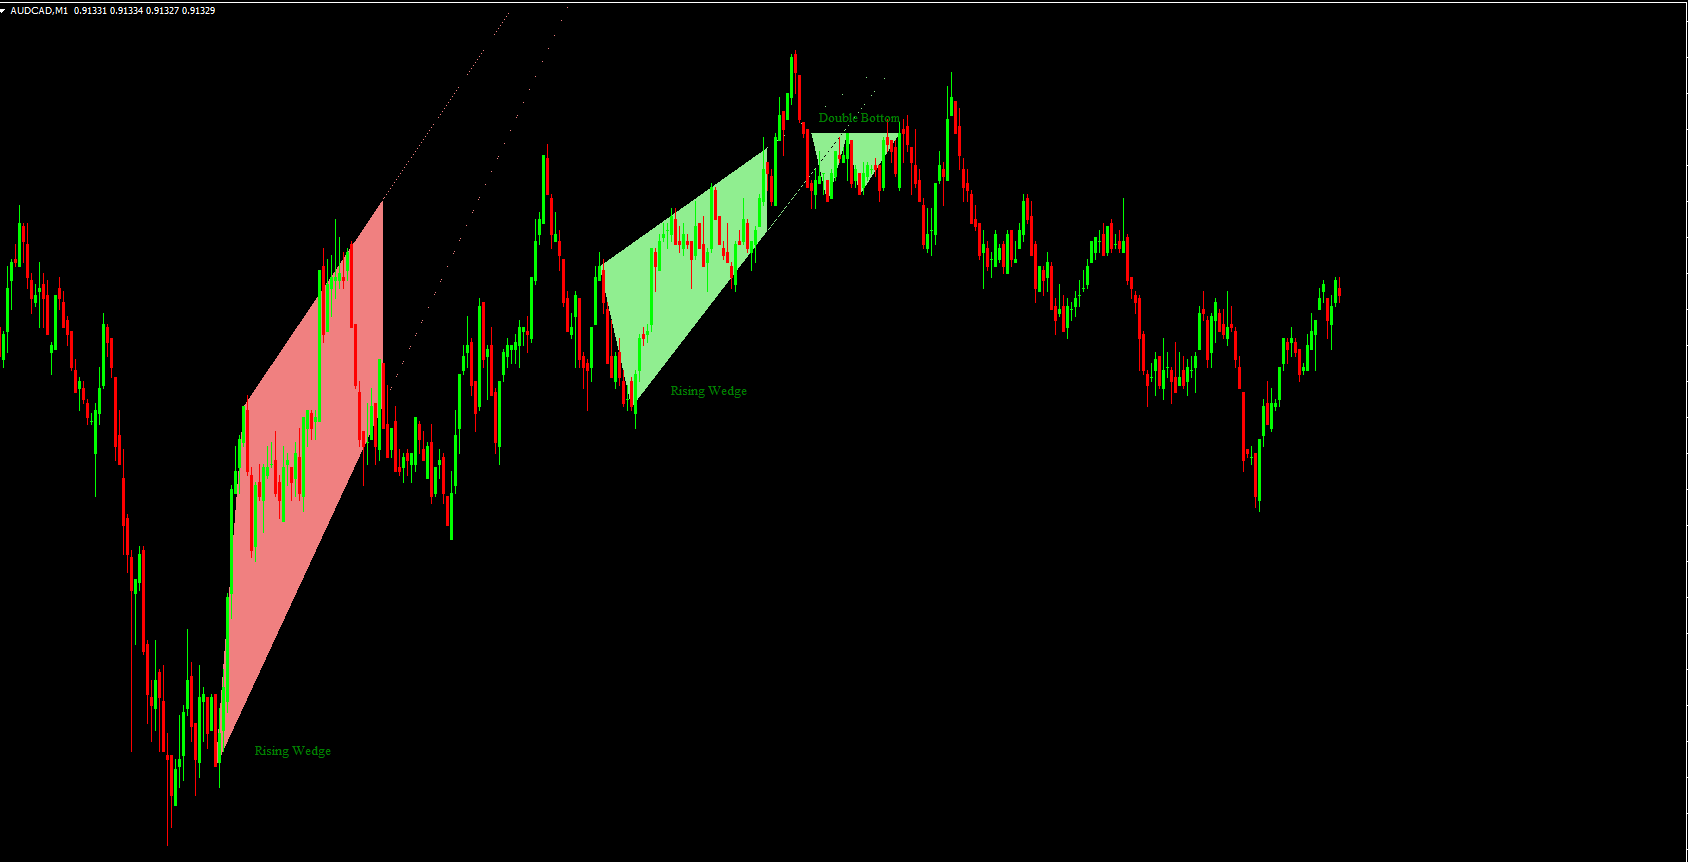
The indicator automatically identifies and highlights common price patterns such as Double Tops/Bottoms, Head and Shoulders, Rising/Falling Wedges, and Triangles. Patterns suggesting bullish movements are shown in light-green, while bearish formations are displayed in light-coral, making it easy for traders to interpret market trends at a glance.
Key Features of the Price Pattern Indicator for MT4
Automatic Pattern Detection: Highlights important bullish and bearish price formations.
Visual Alerts: Light-green for bullish and light-coral for bearish patterns.
Notification System: Alerts via screen popups, push messages, and email.
Back-Testing Capability: Allows traders to analyze historical reactions to patterns.
User-Friendly: Designed for both beginners and advanced traders for easy interpretation.
Benefits of Using the Price Pattern Indicator
Trade Entry and Exit: Identify optimal points to BUY or SELL based on confirmed price patterns.
Risk Management: Use patterns in combination with Support And Resistance levels to minimize risk.
Improved Strategy Testing: Back-test historical price patterns to enhance trading performance.
Quick Market Interpretation: Color-coded patterns allow traders to make fast, informed decisions.
How to Use the Price Pattern Indicator Effectively
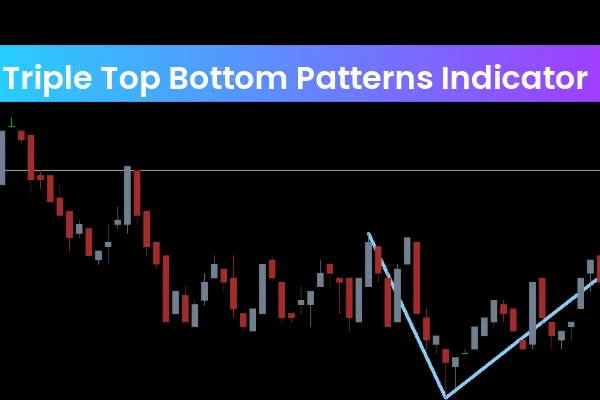
Traders should combine the Price Pattern Indicator with other technical tools such as trend lines, oscillators, or moving averages for confirmation. For example, a Double Bottom forming at a strong support level can be used as a high-probability buying opportunity. Alerts can help traders act in real time without monitoring charts constantly.
Download the Price Pattern Indicator from IndicatorForest.com to enhance your Forex strategy, identify high-probability setups, and make data-driven trading decisions.
FAQ
The indicator automatically identifies and highlights common price patterns such as Double Tops/Bottoms, Head and Shoulders, Rising/Falling Wedges, and Triangles. Patterns suggesting bullish movements are shown in light-green, while bearish formations are displayed in light-coral, making it easy to interpret market trends at a glance.
Use the color-coded patterns to identify optimal points to BUY or SELL based on confirmed price patterns. For example, a Double Bottom forming at a strong support level can be used as a high-probability buying opportunity. Combine patterns with support and resistance levels to minimize risk and improve trade quality.
The indicator includes a notification system that alerts traders via screen popups, push messages, and email when patterns are detected. This helps traders act in real time without constantly monitoring charts, ensuring you don't miss important trading opportunities based on pattern formations.
Yes, the indicator includes back-testing capability that allows traders to analyze historical reactions to patterns. This helps enhance trading performance by understanding how patterns have behaved in the past and improving your ability to recognize high-probability setups in real-time trading.
The Price Pattern Indicator works on all timeframes, from one minute to one month, offering flexibility for scalping, intraday, and swing trading strategies. Patterns can be detected across different timeframes, allowing traders to use higher timeframes for trend confirmation and lower timeframes for precise entries.
2 Downloads
Published:
Dec 16, 2025 01:45 AM
Category: