Master Multi-Timeframe Trends with the Psar Oscillator Heatmap for MT4
In the fast-paced world of technical analysis, traders often face the "lag" problem—relying on a single timeframe that may be providing a false signal compared to the broader market trend. J. Welles Wilder’s Parabolic Stop and Reverse (PSAR) is a legendary tool for identifying trend direction and potential reversals, but its true power is unlocked when viewed across multiple time horizons simultaneously. The Psar Oscillator Heatmap for MetaTrader 4 (MT4) is a professional-grade dashboard utility that transforms standard PSAR data into a comprehensive, color-coded heat map for high-precision decision-making.
What is the Psar Oscillator Heatmap?
The Psar Oscillator Heatmap is a multi-timeframe (MTF) visualizer that plots the status of the Parabolic SAR across various periods in a single sub-window. Instead of cluttering your main price chart with dots, this indicator uses a grid of "heat" blocks to show you exactly where the market stands.
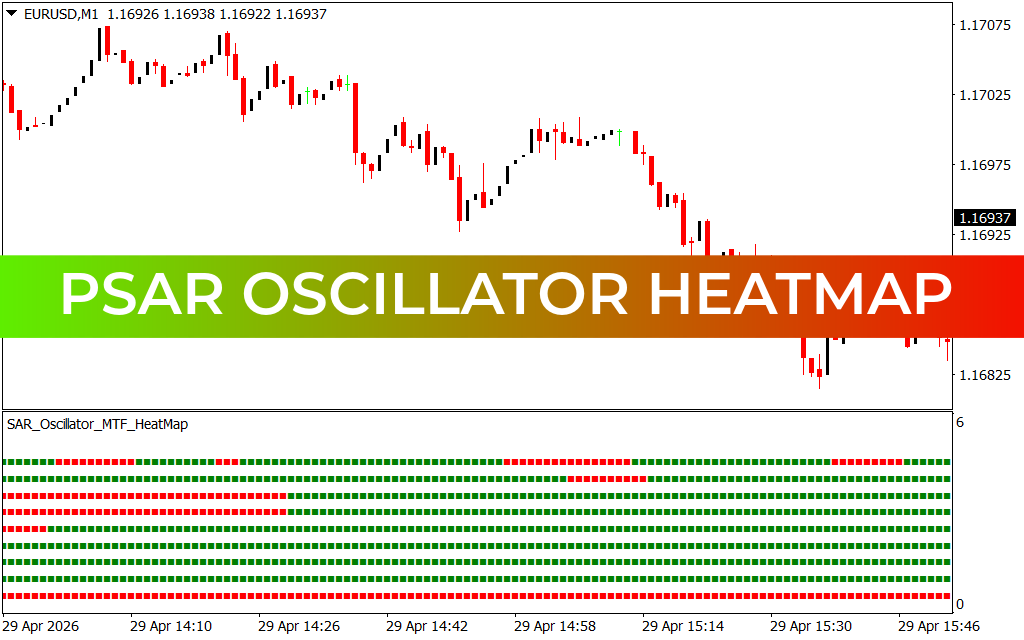
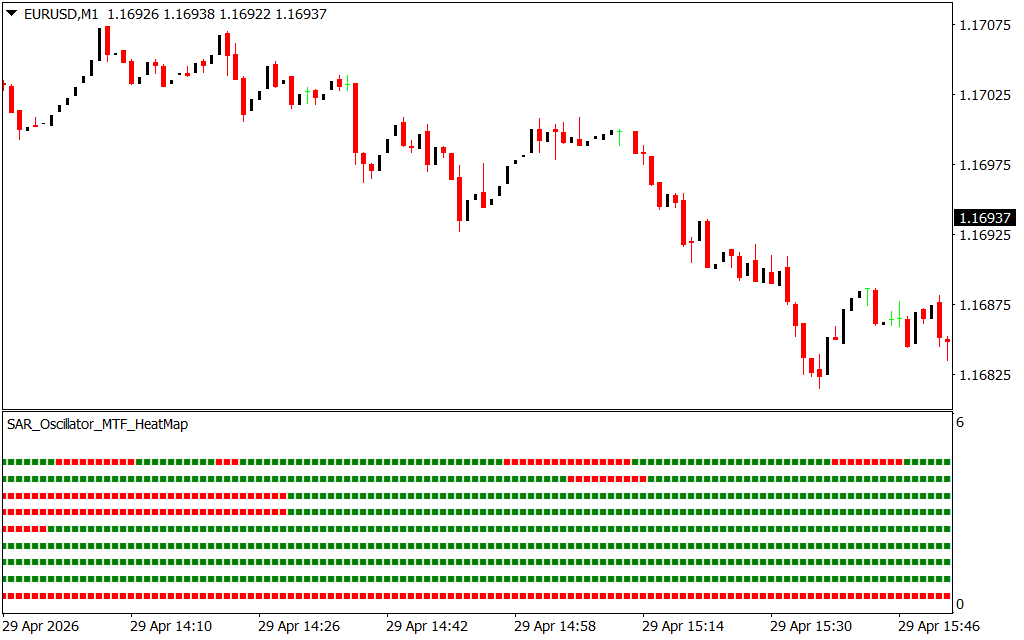
As illustrated on the EUR/USD M1 chart, the heatmap consists of several horizontal rows, each representing a different timeframe or smoothing period:
- Green Blocks: Indicate a bullish PSAR status where momentum is moving upward.
- Red Blocks: Signal a bearish PSAR status where price is under downward pressure.
- Full Alignment: When all rows transition to the same color, it signals a powerful "confluence" event where the short-term momentum aligns with the long-term trend.
The Advantage of Multi-Timeframe Confluence
Why do professional day traders and scalpers prefer a heatmap over standard dots?
- Noise Reduction: A single-timeframe PSAR can "flip" frequently in a ranging market. The heatmap allows you to wait for the higher-period rows to confirm the move, filtering out low-probability whipsaws.
- Instant Market Bias: In one glance, you can see if the overall market is in a "Buy Zone" (mostly green) or a "Sell Zone" (mostly red). This prevents you from trading against the institutional flow.
- Early Warning System: If you are in a long trade and the top rows (shorter timeframes) start turning red, it provides an early warning to tighten your stop-loss or take partial profits before a full reversal occurs.
Strategic Trading Applications
The Psar Oscillator Heatmap is a versatile foundation for several high-conviction strategies:
- The Trend Alignment Trade: Wait for a "unified" signal where the majority of the rows align. On the EUR/USD M1 chart, as the lower rows turn green and align with the top tiers, it signals a statistically significant breakout opportunity.
- Scalping Reversals: Scalpers look for "color flips" on the fastest tiers while the bottom tiers remain stable. This allows for quick "in-and-out" trades during minor retracements within a major trend.
- Exit Management: Use the heatmap as a dynamic trailing stop. Many traders exit their positions the moment a specific number of rows (e.g., the top three) flip to the opposite color, ensuring they capture the bulk of a move without getting caught in the crash.
Conclusion
The Psar Oscillator Heatmap indicator is a mandatory utility for MT4 users who value structural logic over guesswork. By organizing Parabolic SAR data into a logical, multi-tiered visual system, it removes the complexity of manual timeframe switching. Whether you are hunting for explosive breakouts or managing long-term trend entries, this heatmap provides the data-driven clarity required to trade with professional-grade precision.
3 Downloads
Last Update:
Apr 29, 2026 20:33 PM
Published:
Jan 30, 2026 19:35 PM
Category: