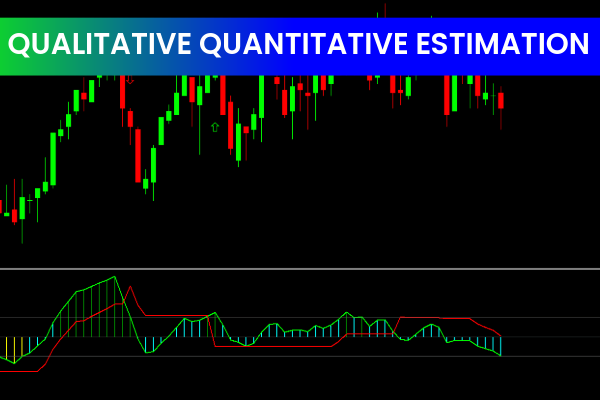
A Dual-Layered Indicator for Clear Market Signals
The Qualitative Quantitative Estimation (QQE) Indicator is a powerful and free Forex trading tool that combines both qualitative and quantitative analysis to help traders better interpret market conditions. Unlike basic oscillators that rely on a single data set, the QQE uses a refined smoothing algorithm to generate highly reliable signals, making it a favorite among beginner and experienced traders alike.
Its unique ability to capture trend direction, strength, momentum shifts, and potential reversals makes it an excellent all-around indicator for various trading strategies.
Features of the QQE Indicator
Dual-Line Signal System
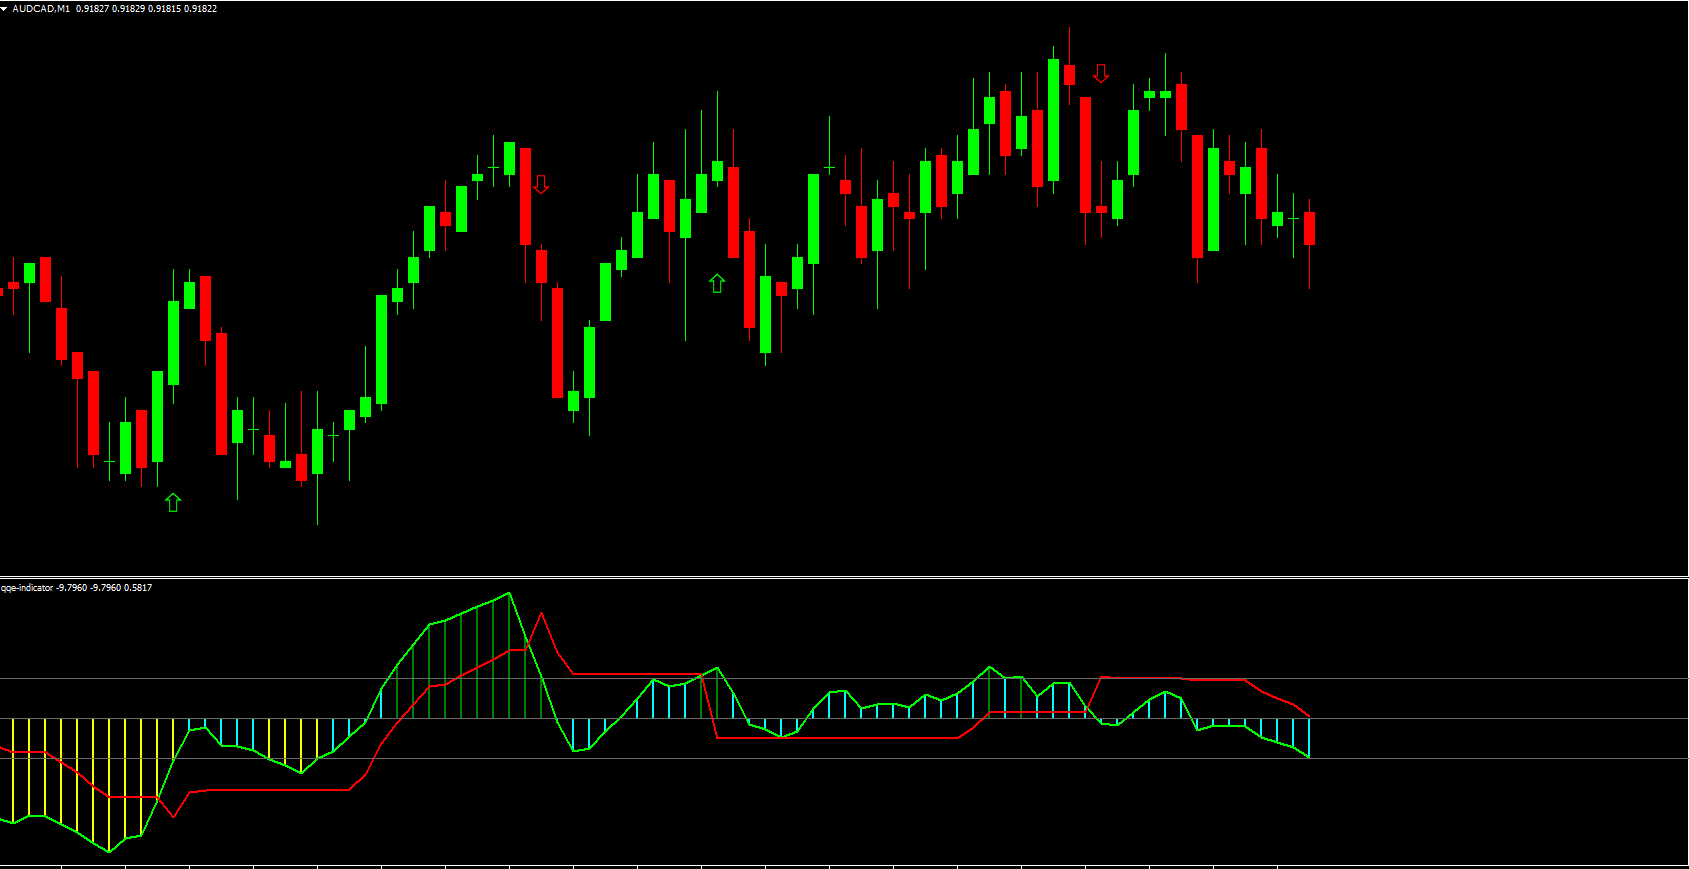
The QQE Indicator plots two main lines:
Green Line – The primary signal line
Red Line – The smoothed, lagging confirmation line
A bullish signal occurs when the green line crosses above the red line.
A bearish signal occurs when the green line crosses below the red line.
This straightforward system helps traders instantly recognize trend shifts.
Trend Identification
The QQE smooths out price fluctuations, allowing you to easily see whether the market is trending upward, downward, or moving sideways. This makes it ideal for both trend-following and reversal strategies.
Overbought & Oversold Detection
Similar to RSI-based mechanics, the QQE efficiently identifies extreme market conditions. When readings reach elevated levels, price may be overextended—helping traders anticipate pullbacks or reversals.
Divergence Spotting
The indicator also helps identify divergences between Price Action and momentum, which are known to be strong early signs of potential market reversals.
How the QQE Indicator Can Benefit You
Incorporating the QQE Indicator into your trading strategy can offer several advantages:
Improved Trend Clarity
The green–red line crossover makes identifying bullish and bearish shifts extremely simple. This helps traders avoid reacting emotionally and instead follow objective signals.
Enhanced Entry and Exit Timing
By highlighting overbought, oversold, and divergence zones, the QQE gives traders better insight into when to enter, exit, or hold positions.
Suitable for All Trading Styles
Whether you trade:
Intraday (1m, 5m, 15m)
Swing trading (H1, H4)
Position trading (Daily, Weekly)
…the QQE adapts reliably across all timeframes.
Works With Any Forex Pair or Asset
The indicator functions smoothly on:
Major and minor Forex pairs
Metals
Indices
Crypto
Commodities
This versatility makes it a valuable part of any trading toolkit.
Conclusion
The QQE Indicator for MT4 stands out as a robust tool that merges qualitative insight with quantitative precision. With its clear crossover signals, divergence detection, and ability to highlight overbought and oversold zones, it empowers traders to make more confident decisions. Whether you are a beginner learning Market Structure or a seasoned trader refining your strategy, the QQE Indicator can significantly enhance your technical analysis.
For more MT4 trading tools, indicators, and strategies, visit IndicatorForest.com.
FAQ
1 Download
Published:
Dec 11, 2025 09:13 AM
Category: