Master Market Cycles with the RBCI Histogram Indicator for MT4
In the realm of advanced technical analysis, the ability to distinguish between a dominant trend and temporary market noise is what separates profitable traders from the rest. While standard moving averages often suffer from significant lag, and oscillators can provide premature signals in trending markets, the RBCI (Range Bound Composition Index) Histogram Indicator offers a mathematically superior alternative. Designed for the MetaTrader 4 (MT4) platform, the RBCI is a digital filter-based indicator that isolates the trend-following component of Price Action, providing a high-definition view of market cycles.
The Science of Digital Filtering in Trading
The RBCI is rooted in the principles of digital signal processing (DSP). Most technical indicators use simple arithmetic to average price, but the RBCI utilizes a "band-pass filter" approach. It works by removing both high-frequency noise (random price fluctuations) and low-frequency components (the long-term trend) to focus specifically on the medium-term market cycle. This results in an indicator that is remarkably stable, yet highly responsive to genuine shifts in market direction.
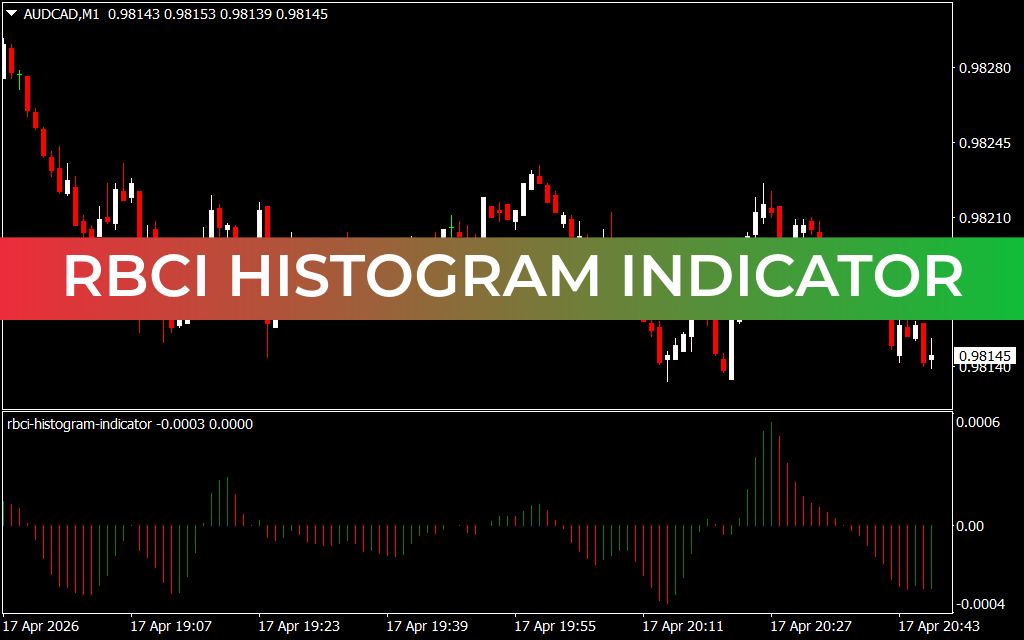
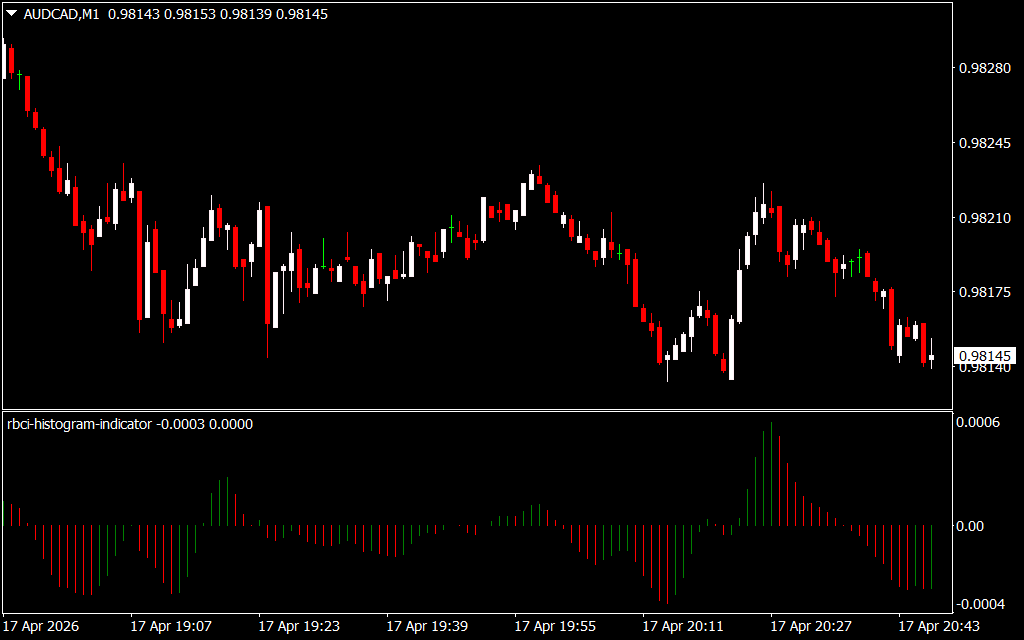
As demonstrated in technical analysis across pairs like AUD/CAD on the M1 timeframe, the RBCI Histogram provides a definitive operational edge:
- Zero-Line Crossover Logic: The RBCI oscillates around a central zero line. A shift from a negative (red) histogram to a positive (green) histogram indicates that the market cycle has turned bullish. Conversely, a move from positive to negative signals a bearish shift. This provides traders with an objective, mechanical trigger for entries and exits.
- Visualizing Cycle Extremes: The peaks and troughs of the histogram represent the maximum extension of a market cycle. When the histogram bars begin to shorten after reaching an extreme, it serves as a powerful leading indicator that the current momentum is exhausting, allowing traders to tighten stops or take profits before the price actually reverses.
- Precision Scalping Capabilities: Because the RBCI is exceptionally smooth compared to traditional oscillators like the RSI or MACD, it is a favorite for high-frequency traders. On lower timeframes like the M1, it filters out the "flicker" of price movement, allowing scalpers to follow the micro-trend with much higher confidence.
- Divergence Analysis: Like all high-quality oscillators, the RBCI is excellent at identifying divergences. If price makes a new high but the RBCI histogram makes a lower high, it signals that the underlying cyclical strength is fading—a classic warning of an impending trend collapse.
Strategic Implementation for Professional Traders
The RBCI Histogram Indicator is an essential asset for any trader who values mathematical precision over subjective guesswork.
- Trend Alignment: Use the RBCI to confirm the direction of your trade. If you are looking for a "Buy" setup, ensure the RBCI histogram is green and rising above the zero line.
- Filter for Fake-outs: Avoid entering breakouts that are not supported by a corresponding spike in the RBCI histogram. If price moves but the RBCI remains flat, the move is likely a low-conviction trap.
- Confluence with Price Action: Combine the RBCI with Support And Resistance levels. A bullish zero-line cross occurring exactly at a major support zone creates a high-probability "Goldilocks" entry point.
Conclusion
The RBCI Histogram Indicator for MT4 is a definitive solution for traders who demand clarity and mathematical rigour. By bridging the gap between digital signal processing and financial speculation, it empowers you to navigate the markets with professional-grade precision. Elevate your technical analysis today and master the flow of market cycles with the RBCI system.
1 Download
Last Update:
Apr 17, 2026 23:49 PM
Published:
Feb 08, 2026 10:33 AM
Category: