Trading High-Velocity Reversals: Scaling with the RSI Arrow Indicator
Trading volatile, ultra-low timeframes like the 1-minute (M1) chart requires flawless operational execution and sharp data filtering. On high-frequency charts, liquid currency pairs like the EUR/USD generate significant market noise. For day traders and scalpers, attempting to manually parse through every individual candlestick wick quickly leads to cognitive overload, delayed execution, and costly drawdowns.
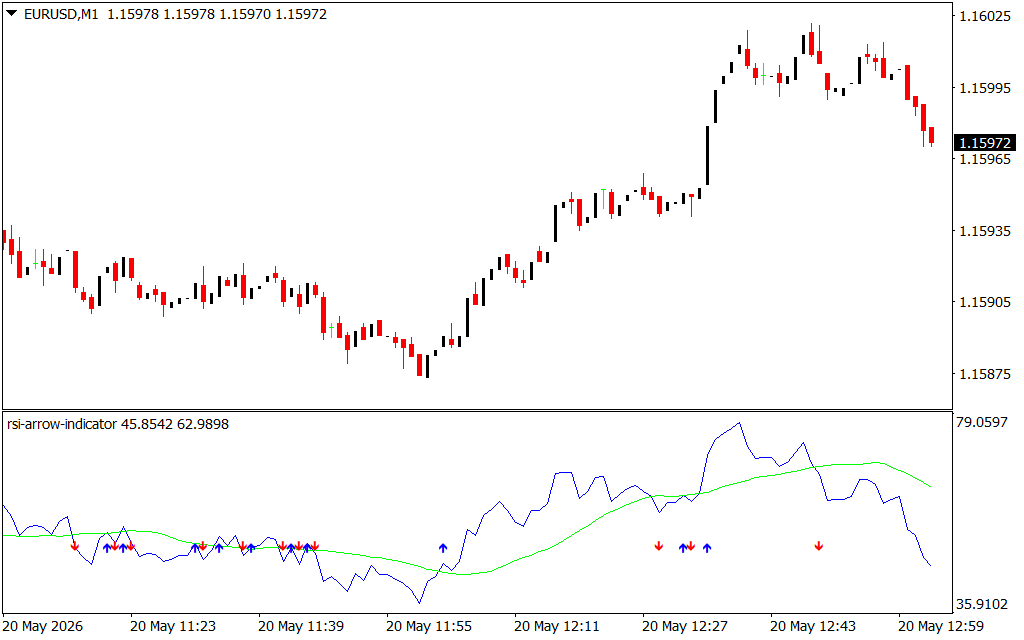
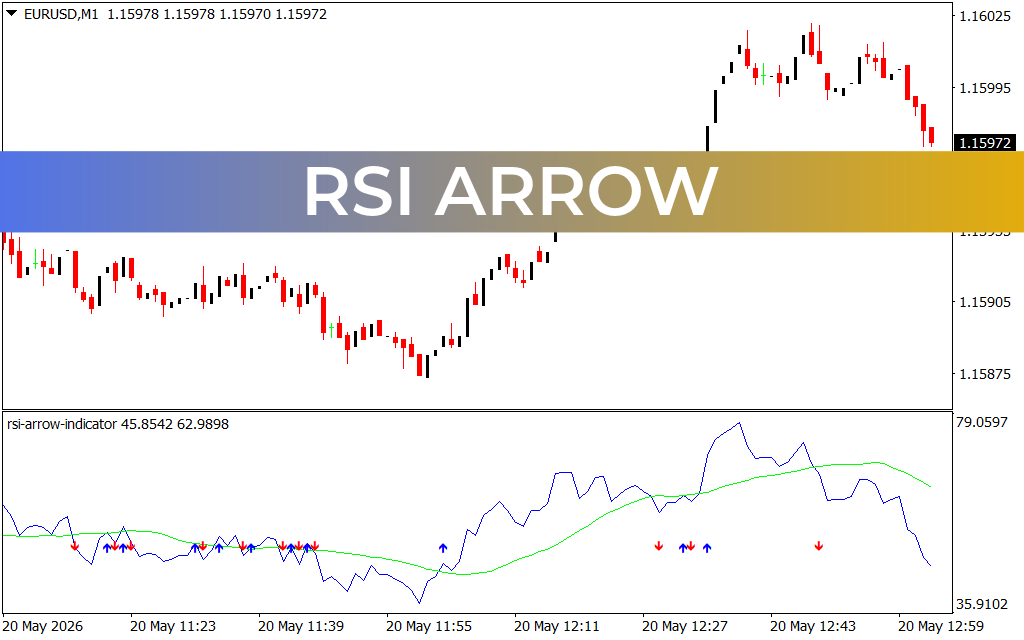
Looking closely at the EUR/USD M1 Price Action during the May 20th session, the market showcases a rapid shift in retail and institutional behavior. The asset initially traded within a compact, choppy consolidation floor below the 1.15935 level. Following an intensive accumulation sequence, buying volume flooded the market around 11:55, triggering an explosive trend extension. The exchange rate rapidly surged through local structure to form a local peak near 1.16025 before experiencing a minor distribution phase.
To capitalize on these lightning-fast momentum expansions while protecting your trading equity, integrating automated execution alerts is standard professional practice. This is precisely where the RSI Arrow indicator transforms your workflow.
Redefining Momentum Tracking with Precise Visual Triggers
The Relative Strength Index (RSI) is an industry-standard technical tool used to evaluate the internal velocity of a financial instrument. However, traditional line oscillators require traders to constantly split their attention between raw price delivery and a separate indicator window. This visual disconnect often results in missed execution entries during rapid market developments.
The RSI Arrow indicator solves this operational hurdle by mathematically mapping the relationship between the classic blue RSI line and its smoothed green signal average, projecting actionable entry alerts directly onto your primary charting sub-window:
- Bullish Expansion Alerts: As the EUR/USD stabilized near its lower liquidity bounds, the oscillator line crossed decisively above its signal line from an oversold condition. The script immediately prints a crisp blue arrow at the bottom of the oscillator pane. This signals a clean momentum transition, warning shorts to exit and giving scalpers a clear trigger right before the sharp vertical rally.
- Bearish Exhaustion Alerts: Conversely, when price pushes into overextended territory above the 70 threshold, the indicator displays distinct red arrows. These flags alert you that the immediate buying velocity is depleting, providing an ideal exit target for long positions or an early entry signal for counter-trend Scalping.
Maximizing Intraday Platform Efficiency
The difference between successful scaling and account drawdown comes down to execution speed. Relying on an automated signal layout eliminates psychological hesitation and standardizes your risk parameters. The indicator’s customizable backend allows you to fine-tune oscillation periods, smooth out raw market volatility, and enable instant audio or push notifications the exact moment an arrow prints. By overlaying this institutional-grade filtering utility onto your MetaTrader architecture, you can confidently sidestep market fakeouts, align your portfolio with real-time institutional volume, and manage your account equity with clinical precision.
2 Downloads
Last Update:
May 20, 2026 16:04 PM
Published:
Jan 18, 2026 18:47 PM
Category: