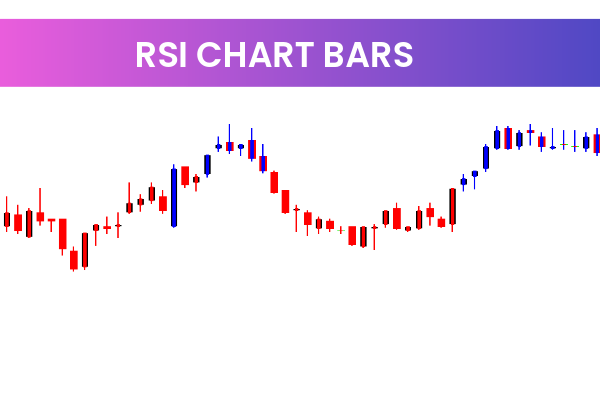
The RSI Chart Bars Indicator MT4 is a popular and free Forex Indicator designed specifically for traders using the MetaTrader 4 platform. This indicator provides a simple yet powerful way to identify overbought and oversold market conditions by visually displaying RSI signals directly on the price chart.
Instead of analyzing a separate oscillator window, traders can instantly see market conditions through color-changing chart bars, making decision-making faster and more intuitive. The RSI Chart Bars Indicator MT4 is suitable for both beginner and experienced traders who want clear and immediate RSI-based insights.
Understanding the RSI Chart Bars Indicator
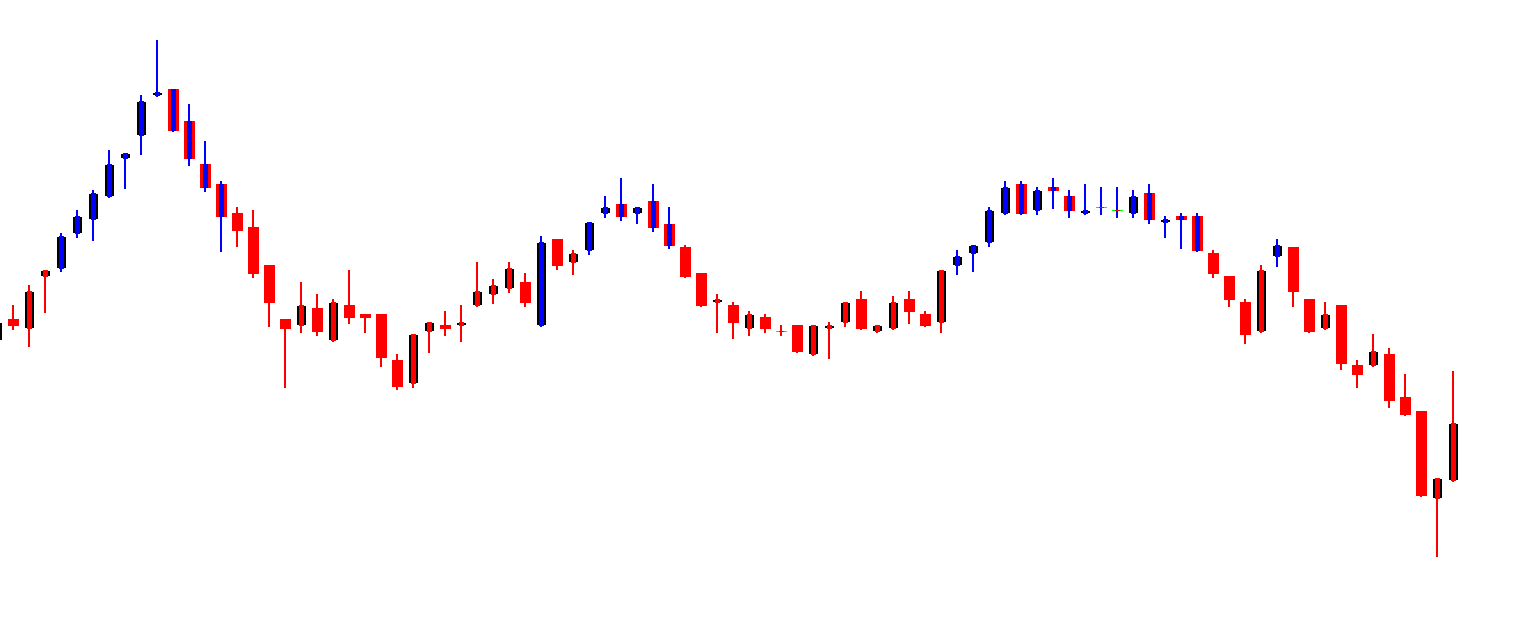
The RSI Chart Bars Indicator is built on the Relative Strength Index (RSI), a widely used momentum oscillator. However, instead of plotting RSI as a line in a separate window, this indicator displays RSI information directly on the main chart using colored bars.
Key characteristics include:
Green Bars: Indicate oversold market conditions and potential buying opportunities
Red Bars: Indicate overbought market conditions and potential selling opportunities
Real-Time Updates: Chart bars change color dynamically as RSI values shift
This visual approach helps traders instantly recognize momentum extremes without switching between indicators.
How the RSI Chart Bars Indicator MT4 Works
The indicator analyzes price movements using a selected RSI period and then translates RSI values into visual chart bars:
When RSI moves above the overbought level, chart bars turn red
When RSI drops below the oversold level, chart bars turn green
Neutral RSI values keep bars in their default state
Traders can customize:
RSI calculation period
Overbought and oversold levels
Timeframe used for analysis
Bar colors and line width
These customization options allow traders to adapt the indicator to their trading style, whether Scalping, day trading, or swing trading.
Why Traders Use RSI Chart Bars Indicator
The RSI Chart Bars Indicator MT4 offers several advantages over traditional RSI displays:
Eliminates the need for separate indicator windows
Improves chart clarity and decision speed
Makes RSI signals easier to interpret visually
Helps confirm trade entries and exits
Works well alongside trend and Price Action strategies
Because the indicator displays RSI signals directly on price bars, traders can focus on price behavior while still benefiting from momentum analysis.
Trading Strategies Using RSI Chart Bars Indicator
Many traders use this indicator in combination with other tools:
Trend Confirmation: Trade RSI oversold signals only in bullish trends
Reversal Trading: Look for RSI overbought or oversold conditions near key support or resistance
Entry Timing: Use RSI color changes to fine-tune entries after trend confirmation
The RSI Chart Bars Indicator MT4 works best when used as part of a broader trading strategy rather than as a standalone signal generator.
Benefits of RSI Chart Bars Indicator MT4
Clearly identifies overbought and oversold conditions
Displays RSI signals directly on the chart
Fully customizable for different strategies
Easy to install and use
Free and compatible with MT4
Ideal for beginners and advanced traders
With its simplicity and visual clarity, this indicator helps traders reduce hesitation and react faster to changing market conditions.
Trade Smarter with RSI Chart Bars Indicator
If you are looking for a clean and effective way to spot overbought and oversold markets, the RSI Chart Bars Indicator MT4 is an excellent choice. Visit IndicatorForest.com to download this free indicator and explore a wide range of professional Forex tools designed to improve your trading performance.
4 Downloads
Published:
Dec 25, 2025 15:59 PM
Category: