The Relative Strength Index (RSI) is a widely used tool that measures price momentum and identifies overbought or oversold conditions in the market. However, one challenge traders face is that standard RSI rarely reaches extreme levels, limiting clear trading signals. The RSI Divergence v2 Indicator for MT4 addresses this limitation by highlighting divergences between price and the RSI, helping traders anticipate potential trend reversals and continuation points.
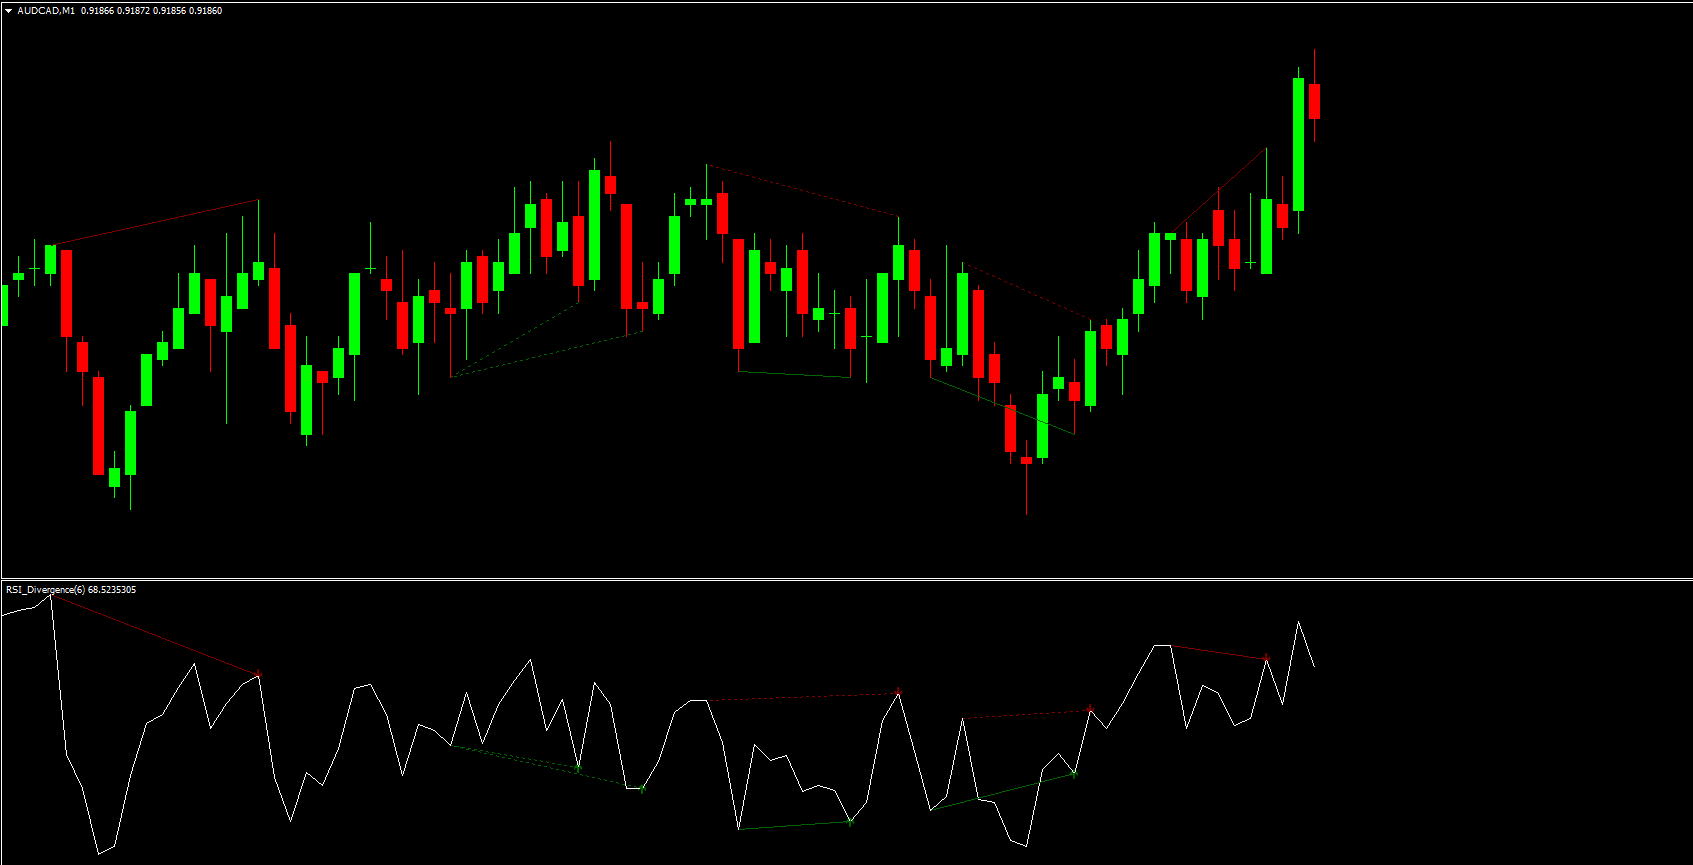
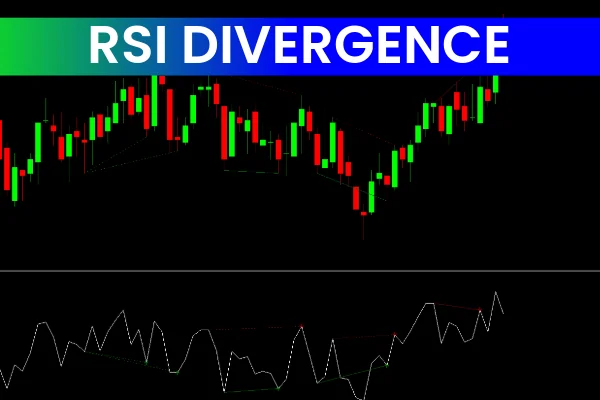
This indicator plots divergence lines in a separate window on the chart. The green lines indicate bullish divergence, suggesting upward momentum, while the red lines indicate bearish divergence, signaling potential downward movement. By using these signals, traders can enter trades at optimal points and manage risk more effectively.
How the RSI Divergence v2 Indicator Works
Bullish Divergence
A bullish divergence occurs when the RSI forms higher lows while the price forms lower lows. This pattern indicates that selling pressure is weakening, and the market may be preparing for an upward reversal.
Traders can use this signal to:
Enter long trades early in a potential Trend Reversal.
Identify optimal stop-loss placements below recent swing lows.
Monitor momentum to confirm the Trend Continuation.
Bearish Divergence
A bearish divergence forms when the RSI makes lower highs while the price makes higher highs. This pattern signals that buying pressure is losing strength, potentially leading to a downward trend.
Traders can use this signal to:
Enter short trades during the start of a reversal.
Set stop-loss above recent swing highs.
Combine with trend confirmation tools for more accurate entries.
Benefits of Using the RSI Divergence v2 Indicator
Anticipate Market Reversals
The indicator helps traders spot potential turning points before the market fully reverses. This early detection can improve entry timing and enhance risk-to-reward ratios.
Clear Visual Signals
Unlike standard RSI, the Divergence v2 indicator draws colored lines on the chart window, making it easier to interpret divergence patterns without guessing or complex calculations.
Supports Multiple Trading Styles
The indicator works well for Scalping, intraday trading, and swing trading. Its versatility across different timeframes allows traders to incorporate it into various strategies.
Confluence with Other Indicators
Traders can use the RSI Divergence v2 alongside trend-following tools, moving averages, support/resistance levels, or candlestick patterns for confirmation, improving overall trade accuracy.
How Traders Use the RSI Divergence v2 Indicator
Apply the indicator to an MT4 chart.
Look for green or red divergence lines indicating bullish or bearish divergence.
Confirm the signal with price action or other technical indicators.
Enter trades based on the direction of divergence.
Place stop-loss orders near the recent swing high/low for risk management.
By following this workflow, traders can effectively spot reversals, catch early trend moves, and optimize trade outcomes.
Conclusion
The RSI Divergence v2 Indicator MT4 is an essential tool for forex traders seeking to identify early market reversals. By highlighting bullish and bearish divergences, it allows traders to anticipate trend changes, improve trade timing, and enhance profitability. Its clear visual signals and versatility make it suitable for beginners and advanced traders alike.
For more advanced MT4 indicators and forex trading tools, visit IndicatorForest.com.
FAQ
1 Download
Published:
Dec 11, 2025 09:39 AM
Category: