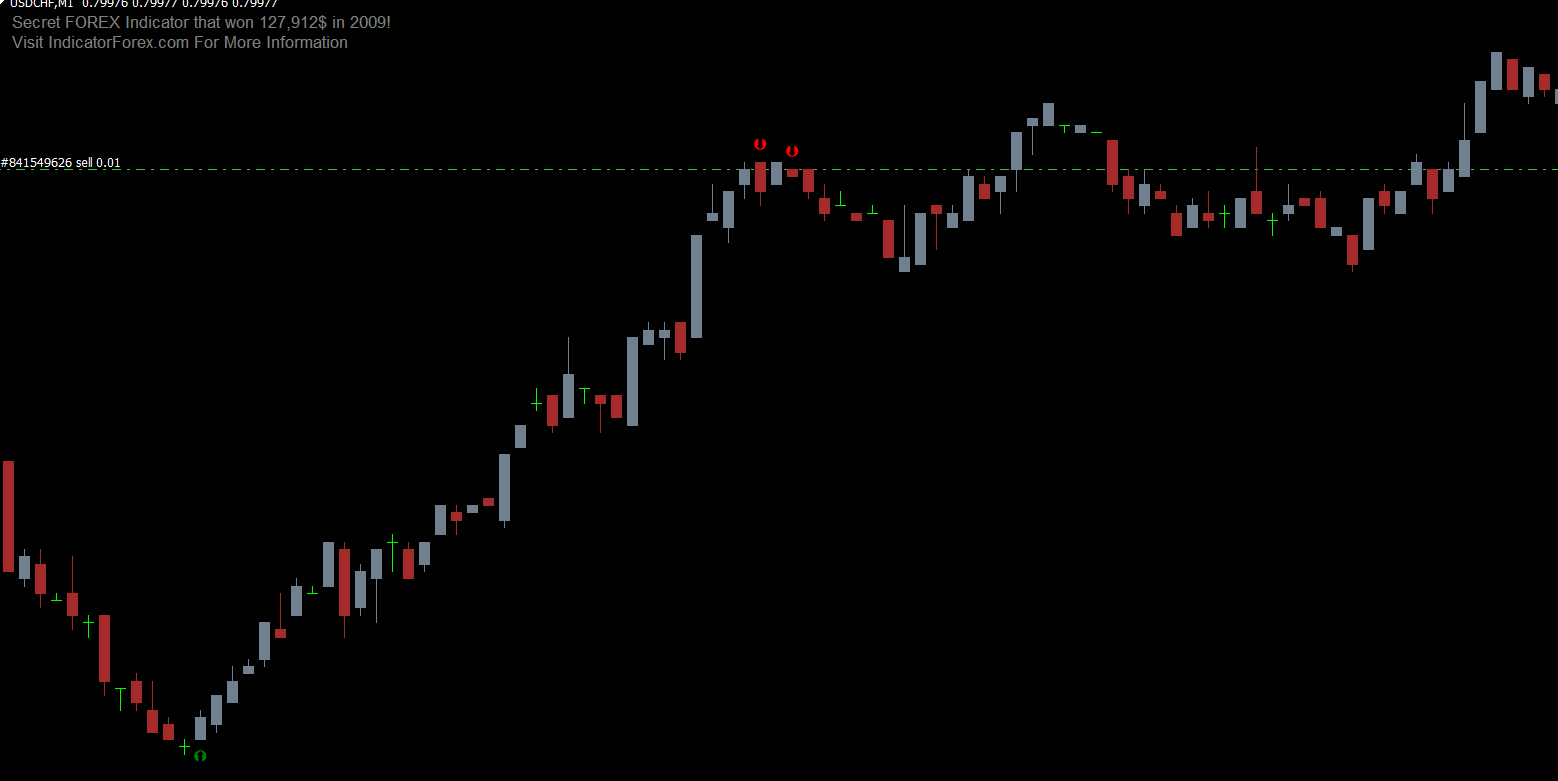
The RSI Signal Indicator for MT4 is a powerful enhancement of the traditional Relative Strength Index (RSI), designed to help forex traders detect overbought and oversold market conditions with ease. This tool not only provides notifications when key RSI levels are reached but also displays buy and sell arrows on the chart, offering a clear visual guide for trade entries and exits.
Receiving alerts when the RSI enters extreme zones can be highly advantageous. Traders focusing on Trend Reversal strategies can capitalize on these signals to enter positions at optimal levels, minimizing guesswork and enhancing trading accuracy.
Features of the RSI Signal Indicator
Overbought and Oversold Alerts: Get notifications when RSI crosses 70 (overbought) or 30 (oversold).
Visual Signals: Green arrows for buy opportunities and red arrows for sell signals.
User-Friendly: Simple interface that integrates seamlessly with MT4.
Enhanced Trade Timing: Helps traders enter or exit trades more efficiently by confirming market extremes.
Versatile Application: Suitable for all timeframes and currency pairs.
By combining traditional RSI analysis with visual and alert signals, the RSI Signal Indicator simplifies decision-making and reduces the risk of missed trading opportunities.
How to Use the RSI Signal Indicator for MT4
Buy Setup (Oversold Condition)
When RSI falls below 30, the market is considered oversold.
The indicator will display a green arrow on the chart.
Wait for the next candle to form before entering the trade.
Place a stop-loss at the previous swing low.
Exit the trade when the indicator signals a red arrow, indicating a potential reversal.
Sell Setup (Overbought Condition)
When RSI rises above 70, the market is considered overbought.
The indicator will display a red arrow on the chart.
Enter the trade at the close of the next candle.
Place a stop-loss at the previous swing high.
Exit the trade when the indicator shows a green arrow, signaling a trend reversal.
Advantages of Using the RSI Signal Indicator
Improved Accuracy: Reduces reliance on manual RSI interpretation and ensures timely trade entries.
Visual Clarity: Arrow signals make it easier to see potential opportunities at a glance.
Alerts for Action: Push notifications or on-screen alerts help traders monitor multiple charts simultaneously.
Trend Reversal Insight: Ideal for strategies focused on trading market corrections and reversals.
Free to Use: Available for MT4 with easy installation and setup.
By providing actionable alerts and visual signals, this indicator allows traders to make informed decisions and respond promptly to changing market conditions.
Conclusion
The RSI Signal Indicator for MT4 is an essential tool for forex traders who want to enhance the functionality of the classic RSI. By combining overbought/oversold notifications with arrow-based buy and sell signals, it simplifies trading decisions and improves accuracy.
Whether you are a beginner learning to interpret RSI or an experienced trader seeking better trade timing, the RSI Signal Indicator can be integrated into any trading strategy. Download and install it on MT4 today to start receiving instant market alerts and visual trade signals.
FAQ
4 Downloads
Published:
Dec 11, 2025 01:04 AM
Category: