The RSIMA Baseline Divergence Indicator for MT4 is a powerful technical tool designed to detect high-quality divergence signals in Forex and other financial markets. By combining the Relative Strength Index (RSI) with a baseline moving average (MA), this indicator helps traders identify potential trend reversals and fine-tune entry points.
It is suitable for traders of all skill levels—from beginners learning divergence strategies to experts implementing sophisticated trend-following or counter-trend systems.
How the RSIMA Baseline Divergence Indicator Works
The indicator detects opposite behavior between price and RSI to highlight divergence setups:
Bullish Divergence: Occurs when the price forms a lower low while the RSI forms a higher low.
Bearish Divergence: Happens when the price forms a higher high while the RSI forms a lower high.
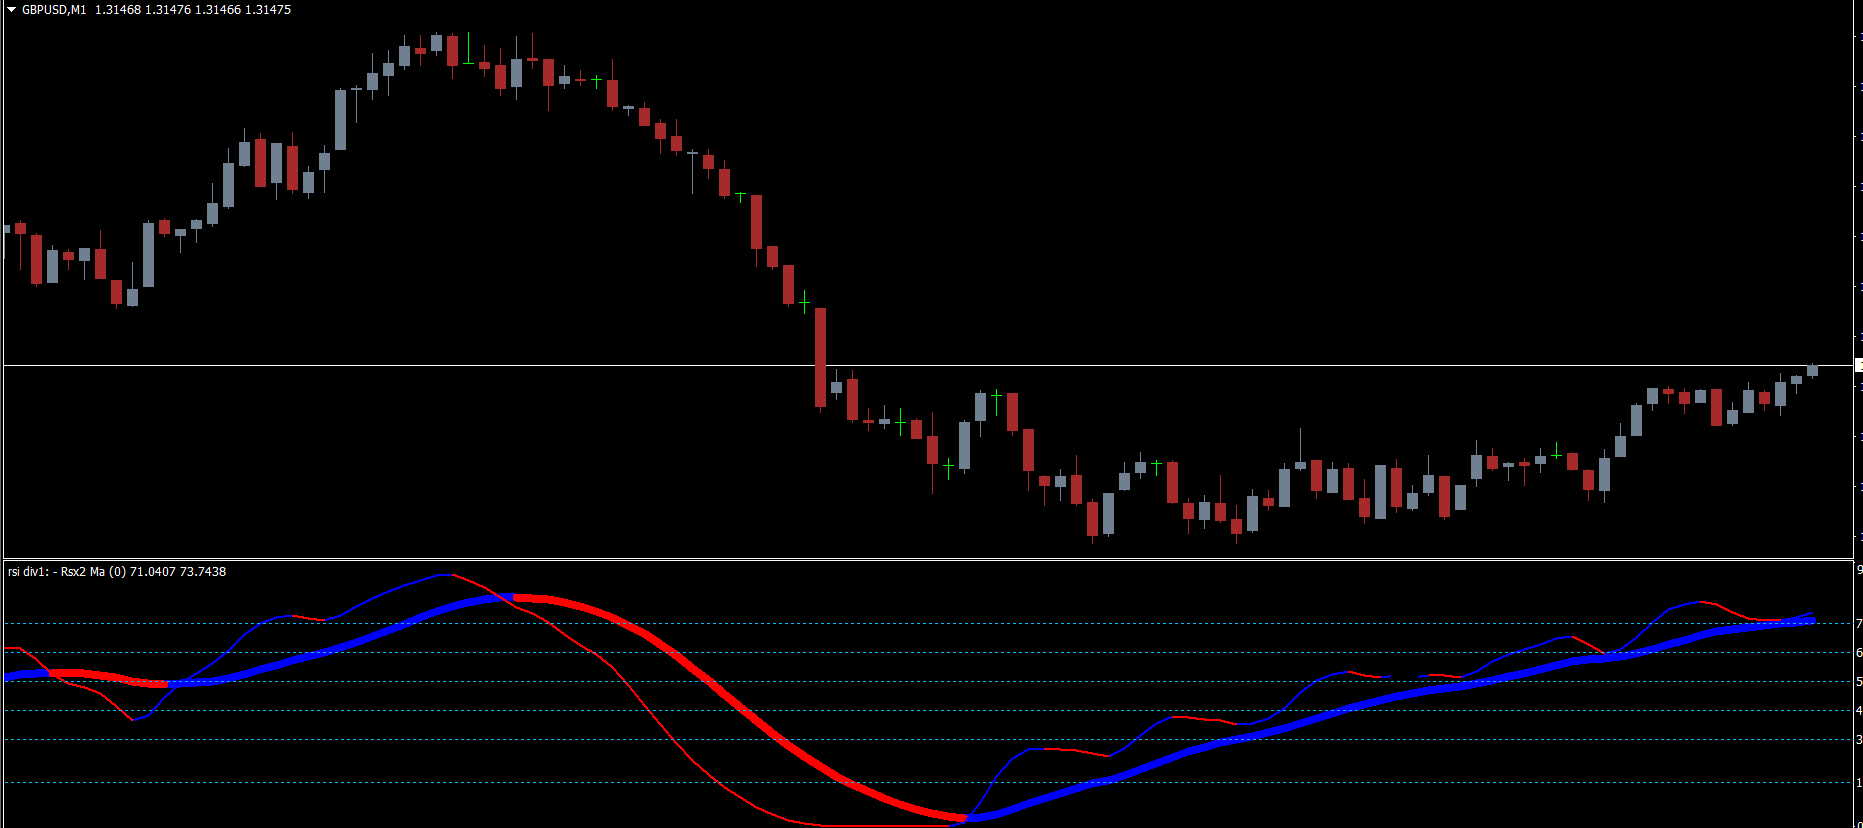
To filter false signals, the indicator adds a baseline MA. Crossover signals are plotted when the RSI crosses the baseline:
Blue Color: Bullish crossover
Red Color: Bearish crossover
These visual cues make it easy to identify reliable divergence setups.
Trading Signals Explained
Buy Signal
A bullish divergence occurs, with RSI below 30 (oversold zone).
RSI crosses above the baseline MA (blue crossover).
Consider entering a BUY / LONG position after confirming with Price Action, e.g., bullish engulfing or hammer candlestick.
Sell Signal
A bearish divergence occurs, with RSI above 70 (overbought zone).
RSI crosses below the baseline MA (red crossover).
Enter a SELL / SHORT position after confirming with a bearish candlestick pattern such as an inverted hammer or bearish engulfing.
Using these rules ensures trades are aligned with high-probability trend-reversal points, reducing risk and improving profitability.
Advantages of RSIMA Baseline Divergence Indicator
High-Quality Divergence Filtering: Reduces false signals compared to standard RSI divergence.
Overbought/Oversold Confluence: Provides additional trading confirmation.
Color-Coded Crossovers: Easy to read and visually intuitive.
Versatile for Strategies: Works for both trend-following and counter-trend approaches.
User-Friendly for All Levels: Novices and experts can easily interpret signals.
Conclusion
The RSIMA Baseline Divergence Indicator for MT4 is an essential tool for traders looking to spot reliable bullish and bearish divergence signals. By combining RSI with a baseline moving average, it provides clear visual cues for trend reversals, overbought/oversold conditions, and optimal entry points. You can download this powerful MT4 indicator for free at IndicatorForest.com and enhance your trading strategy today.
FAQ
5 Downloads
Published:
Nov 18, 2025 12:03 PM
Category: