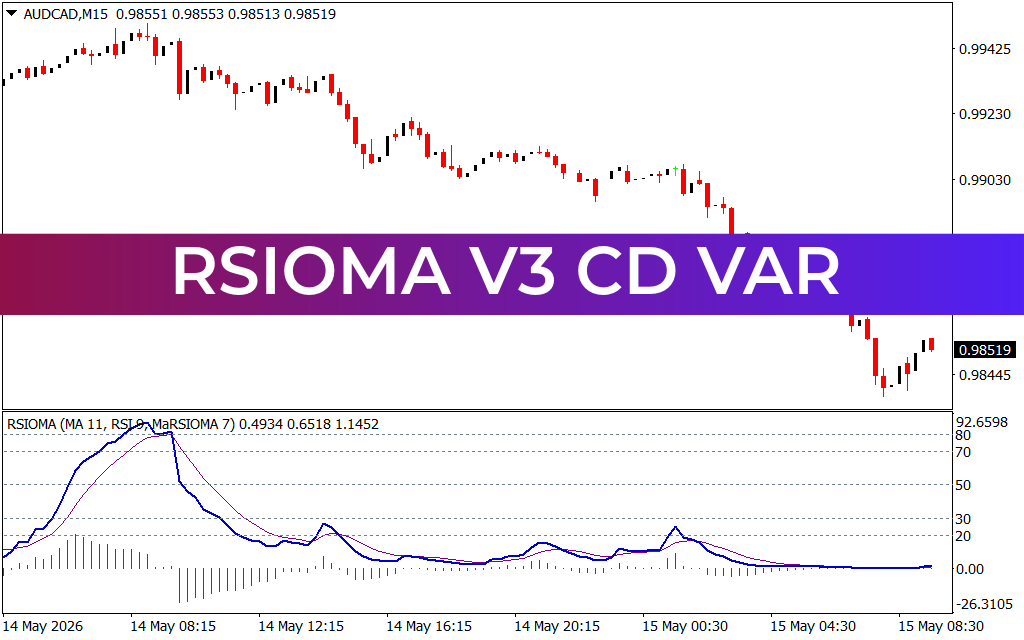
Master the Markets with RSIOMA V3 CD VAR: The Ultimate Trend & Momentum Indicator
In the fast-paced world of Forex trading, the difference between a winning trade and a "whipsaw" loss often comes down to the quality of your filters. Standard indicators like the Relative Strength Index (RSI) are legendary, but they can be noisy in volatile markets. Enter the RSIOMA V3 CD VAR, a sophisticated evolution of the classic momentum oscillator designed to provide smoother, more actionable signals for MetaTrader users.
What is RSIOMA V3 CD VAR?
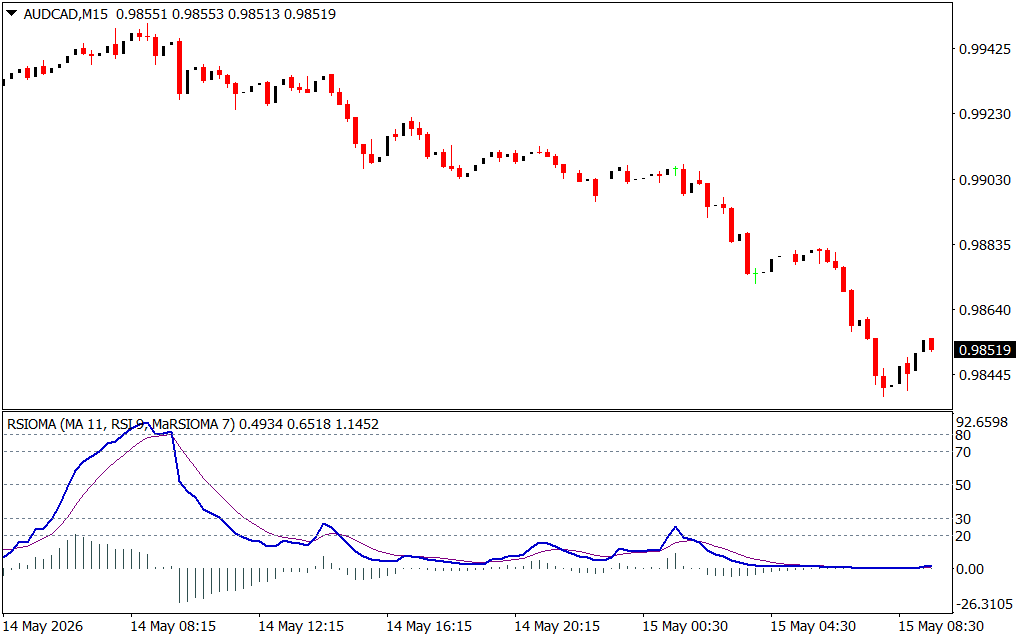
RSIOMA stands for RSI of Moving Average. Unlike a standard RSI that calculates momentum based on raw price closes, RSIOMA applies the RSI formula to a Moving Average. This double-smoothing process filters out "market noise," allowing traders to see the underlying trend with much greater clarity.
The V3 CD VAR version takes this a step further by incorporating Change Direction (CD) logic and Variance (VAR) weighting. This ensures that the indicator reacts quickly to genuine trend reversals while staying stable during minor price fluctuations.
Key Features of RSIOMA V3 CD VAR
- Double Smoothing: By taking the RSI of an MA, it eliminates the jagged edges common in standard oscillators.
- Trend Histogram: Most versions feature an auxiliary histogram that changes color (e.g., Green for Bullish, Red for Bearish) to give you an instant "go/no-go" signal.
- Built-in Signal Lines: It typically includes two lines—the RSIOMA line and its own signal moving average. When these cross, it provides a high-probability entry or exit point.
- Overbought/Oversold Logic: It retains the classic 20/80 or 30/70 levels but applies them to the smoothed trend, reducing the frequency of false "exhaustion" signals.
How to Trade with RSIOMA V3 CD VAR
To get the most out of this indicator on your M15 or H1 charts, follow these core strategies:
- The Trend Cross: Look for the RSIOMA line (often blue) to cross above its signal line for a Buy, or below for a Sell.
- The 50-Level Pivot: The 50-level is the "equator" of the market. If the RSIOMA is above 50, the bulls are in control; below 50, the bears have the upper hand.
- Divergence Hunting: Just like the standard RSI, look for cases where the price makes a new high but the RSIOMA V3 makes a lower high. This is a powerful "early warning" system for a Trend Reversal.
Why Every Trader Needs This Tool
The RSIOMA V3 CD VAR is particularly effective for scalpers and day traders who struggle with the "choppiness" of lower timeframes. It transforms a chaotic price chart into a clean, readable momentum map. Whether you are trading AUD/CAD or high-volatility pairs like GBP/JPY, this indicator provides the "confirmation" layer needed to trade with confidence.
2 Downloads
Last Update:
May 15, 2026 12:38 PM
Published:
Jan 22, 2026 00:32 AM
Category: